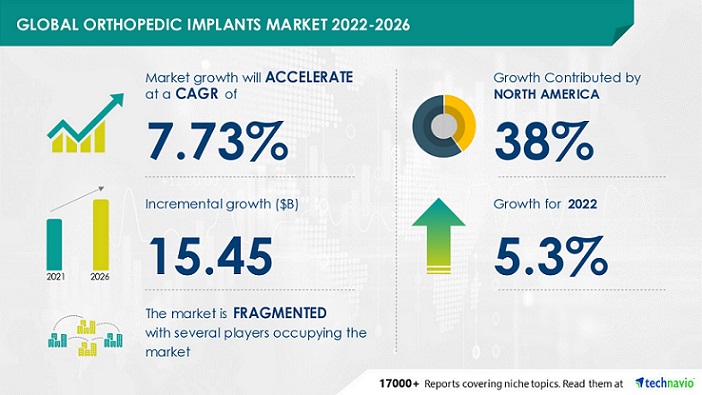
NEW YORK, Aug. 17, 2022 /PRNewswire/ — The latest market analysis report titled Orthopedic Implants Market by Product and Geography – Forecast and Analysis 2022-2026 has been recently added to Technavio’s catalog. The report predicts the market to witness an accelerating growth momentum at a CAGR of 7.73%. The analysts at Technavio have categorized the global orthopedic implants market as a part of the global healthcare equipment market. Our report provides extensive information on the value chain analysis for the orthopedic implants market, which vendors can leverage to gain a competitive advantage during the forecast period. The data available in our value chain analysis segment can help vendors drive costs and enhance customer services during the forecast period.
For insights on the scope and value chain analysis, Read a FREE Sample Report
“Few of the primary growth drivers for this market are the high prevalence of osteoporosis, rise in the incidences of knee injuries, and surge in lucrative opportunities in emerging economies,” says a senior analyst for the health care industry at Technavio. The rising prevalence of orthopedic conditions such as fractures caused by sports injuries, spinal deformities and scoliosis, tendon injuries, degeneration of the disc, and others has increased the demand for orthopedic implants. The lucrative market landscape is further prompting vendors to innovate and launch new products, which will help them capture a larger customer base. In addition, The rising number of strategic alliances is a key orthopedic implants market trend that is expected to have a positive impact in the coming years. Strategic alliances can help companies that manufacture medical equipment to explore additional opportunities without incurring a considerable financial burden.
However, the high costs associated with orthopedic implants and procedures will be a major challenge for the orthopedic implants market during the forecast period. Orthopedic implants are used for the treatment of orthopedic conditions related to joint, spine, and maxillofacial injuries. The cost of such equipment depends on applications and features and varies based on their type. Such factors are expected to limit the market’s growth during the forecast period.
More key dynamics and their impact analysis are available at Technavio, Request for a Sample Copy
Orthopedic Implants Market Segment Highlights
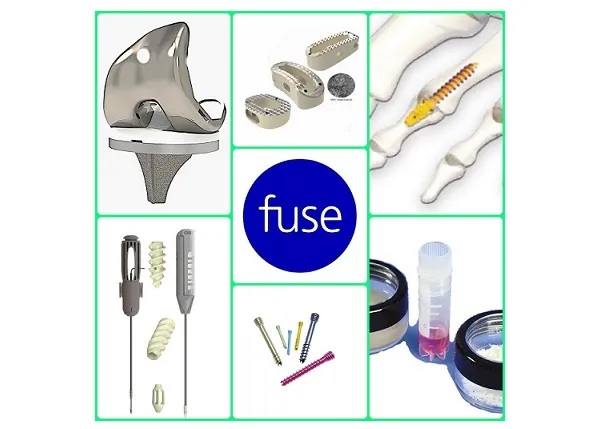
- The orthopedic implants market has been segmented by product into Joint reconstruction implants, Spinal implants, and Craniomaxillofacial implants.
- The orthopedic implants market share growth in the joint reconstruction implants segment will be significant during the forecast period.
- Factors such as the increasing number of orthopedic conditions, including knee and hip fractures, new product launches, the growing trend of robotic surgeries, and the presence of established players with a strong product portfolio will boost the growth of this segment during the forecast period.
- The increasing prevalence of orthopedic conditions such as osteoporosis, arthritis, hip and knee injuries, and bone deformities will augment the demand for joint reconstruction implants during the forecast period.
Regional Analysis
- 38% of the market’s growth will originate from North America during the forecast period.
- US and Canada are the key markets for orthopedic implants in North America. Market growth in this region will be slower than the growth of the market in the European and Asian regions.
- The rising prevalence of orthopedic conditions, product launches, favorable reimbursement for orthopedic implants, and initiatives by governments and non-profit organizations for creating awareness about orthopedic conditions will facilitate the orthopedic implants market growth in North America over the forecast period.
- Germany, the UK, and China are other revenue-generating economies for the orthopedic implants market.
Download Sample PDF to Know about Segment-based Detailed Analysis and Regional Insights
Vendor Landscape:
- The orthopedic implants market is fragmented and the vendors are deploying organic and inorganic growth strategies to compete in the market.
- To make the most of the opportunities and recover from the post-COVID-19 impact, market vendors should focus more on the growth prospects in the fast-growing segments, while maintaining their positions in the slow-growing segments.
- The orthopedic implants market forecast report offers in-depth insights into key vendor profiles. The profiles include information on the production, sustainability, and prospects of the leading companies.
- The research report offers information on several market vendors, including Amplitude SAS, Arthrex Inc., B. Braun SE, Conmed Corp., Corin Group Plc, Globus Medical Inc., icotec AG, Integra LifeSciences Corp., Johnson and Johnson, Medtronic Plc, Mighty Oak Medical, Naton Medical Group, Nuvasive Inc., Orthofix Medical Inc., OrthoPediatrics Corp., Pega Medical Inc., RTI Surgical Inc., Smith and Nephew plc, Stryker Corp., and Zimmer Biomet Holdings Inc.
- Companies in the market are offering innovative solutions to strengthen their market positions. For instance, Amplitude SAS operates in a unified segment focused on offering diversified products catering orthopedic industry. The company offers orthopedic implants such as Airlock, Nexis, CentroLock, Pecaplasty, Peca, and Lync.
Want to Retrieve Additional Vendor-Specific Information, Download a Sample Report
Related Reports:
Orthopedic Surgical Navigation Systems Market by Technology, End-user, and Geography – Forecast and Analysis 2022-2026
Orthopedic Device Market by Product, Application, and Geography – Forecast and Analysis 2020-2024
Orthopedic Prosthetics Market by Product and Geography – Forecast and Analysis 2020-2024
Orthopedic Splints Market by Application and Geography – Forecast and Analysis 2022-2026
Orthopedic Pedicle Screws Market by Product and Geography – Forecast and Analysis 2022-2026
| Orthopedic Implants Market Scope | |
| Report Coverage | Details |
| Page number | 120 |
| Base year | 2021 |
| Forecast period | 2022-2026 |
| Growth momentum & CAGR | Accelerate at a CAGR of 7.73% |
| Market growth 2022-2026 | $ 15.45 billion |
| Market structure | Fragmented |
| YoY growth (%) | 5.3 |
| Regional analysis | North America, Europe, Asia, and Rest of World (ROW) |
| Performing market contribution | North America at 38% |
| Key consumer countries | US, Canada, Germany, UK, and China |
| Competitive landscape | Leading companies, competitive strategies, consumer engagement scope |
| Companies profiled | Amplitude SAS, Arthrex Inc., B. Braun SE, Conmed Corp., Corin Group Plc, Globus Medical Inc., icotec AG, Integra LifeSciences Corp., Johnson and Johnson, Medtronic Plc, Mighty Oak Medical, Naton Medical Group, Nuvasive Inc., Orthofix Medical Inc., OrthoPediatrics Corp., Pega Medical Inc., RTI Surgical Inc., Smith and Nephew plc, Stryker Corp., and Zimmer Biomet Holdings Inc. |
| Market Dynamics | Parent market analysis, Market growth inducers and obstacles, Fast-growing and slow-growing segment analysis, COVID 19 impact and future consumer dynamics, and market condition analysis for the forecast period. |
| Customization purview | If our report has not included the data that you are looking for, you can reach out to our analysts and get segments customized. |
Browse Technavio’s Healthcare Industry Reports
Table of Content
1 Executive Summary
- 1.1 Market overview
- Exhibit 01: Executive Summary – Chart on Market Overview
- Exhibit 02: Executive Summary – Data Table on Market Overview
- Exhibit 03: Executive Summary – Chart on Global Market Characteristics
- Exhibit 04: Executive Summary – Chart on Market by Geography
- Exhibit 05: Executive Summary – Chart on Market Segmentation by Product
- Exhibit 06: Executive Summary – Chart on Incremental Growth
- Exhibit 07: Executive Summary – Data Table on Incremental Growth
- Exhibit 08: Executive Summary – Chart on Vendor Market Positioning
2 Market Landscape
- 2.1 Market ecosystem
- Exhibit 09: Parent market
- Exhibit 10: Market Characteristics
3 Market Sizing
- 3.1 Market definition
- Exhibit 11: Offerings of vendors included in the market definition
- 3.2 Market segment analysis
- Exhibit 12: Market segments
- 3.3 Market size 2021
- 3.4 Market outlook: Forecast for 2021-2026
- Exhibit 13: Chart on Global – Market size and forecast 2021-2026 ($ million)
- Exhibit 14: Data Table on Global – Market size and forecast 2021-2026 ($ million)
- Exhibit 15: Chart on Global Market: Year-over-year growth 2021-2026 (%)
- Exhibit 16: Data Table on Global Market: Year-over-year growth 2021-2026 (%)
4 Five Forces Analysis
- 4.1 Five forces summary
- Exhibit 17: Five forces analysis – Comparison between2021 and 2026
- 4.2 Bargaining power of buyers
- Exhibit 18: Chart on Bargaining power of buyers – Impact of key factors 2021 and 2026
- 4.3 Bargaining power of suppliers
- Exhibit 19: Bargaining power of suppliers – Impact of key factors in 2021 and 2026
- 4.4 Threat of new entrants
- Exhibit 20: Threat of new entrants – Impact of key factors in 2021 and 2026
- 4.5 Threat of substitutes
- Exhibit 21: Threat of substitutes – Impact of key factors in 2021 and 2026
- 4.6 Threat of rivalry
- Exhibit 22: Threat of rivalry – Impact of key factors in 2021 and 2026
- 4.7 Market condition
- Exhibit 23: Chart on Market condition – Five forces 2021 and 2026
5 Market Segmentation by Product
- 5.1 Market segments
- Exhibit 24: Chart on Product – Market share 2021-2026 (%)
- Exhibit 25: Data Table on Product – Market share 2021-2026 (%)
- 5.2 Comparison by Product
- Exhibit 26: Chart on Comparison by Product
- Exhibit 27: Data Table on Comparison by Product
- 5.3 Joint reconstruction implants – Market size and forecast 2021-2026
- Exhibit 28: Chart on Joint reconstruction implants – Market size and forecast 2021-2026 ($ million)
- Exhibit 29: Data Table on Joint reconstruction implants – Market size and forecast 2021-2026 ($ million)
- Exhibit 30: Chart on Joint reconstruction implants – Year-over-year growth 2021-2026 (%)
- Exhibit 31: Data Table on Joint reconstruction implants – Year-over-year growth 2021-2026 (%)
- 5.4 Spinal implants – Market size and forecast 2021-2026
- Exhibit 32: Chart on Spinal implants – Market size and forecast 2021-2026 ($ million)
- Exhibit 33: Data Table on Spinal implants – Market size and forecast 2021-2026 ($ million)
- Exhibit 34: Chart on Spinal implants – Year-over-year growth 2021-2026 (%)
- Exhibit 35: Data Table on Spinal implants – Year-over-year growth 2021-2026 (%)
- 5.5 Craniomaxillofacial implants – Market size and forecast 2021-2026
- Exhibit 36: Chart on Craniomaxillofacial implants – Market size and forecast 2021-2026 ($ million)
- Exhibit 37: Data Table on Craniomaxillofacial implants – Market size and forecast 2021-2026 ($ million)
- Exhibit 38: Chart on Craniomaxillofacial implants – Year-over-year growth 2021-2026 (%)
- Exhibit 39: Data Table on Craniomaxillofacial implants – Year-over-year growth 2021-2026 (%)
- 5.6 Market opportunity by Product
- Exhibit 40: Market opportunity by Product ($ million)
6 Customer Landscape
- 6.1 Customer landscape overview
- Exhibit 41: Analysis of price sensitivity, lifecycle, customer purchase basket, adoption rates, and purchase criteria
7 Geographic Landscape
- 7.1 Geographic segmentation
- Exhibit 42: Chart on Market share by geography 2021-2026 (%)
- Exhibit 43: Data Table on Market share by geography 2021-2026 (%)
- 7.2 Geographic comparison
- Exhibit 44: Chart on Geographic comparison
- Exhibit 45: Data Table on Geographic comparison
- 7.3 North America – Market size and forecast 2021-2026
- Exhibit 46: Chart on North America – Market size and forecast 2021-2026 ($ million)
- Exhibit 47: Data Table on North America – Market size and forecast 2021-2026 ($ million)
- Exhibit 48: Chart on North America – Year-over-year growth 2021-2026 (%)
- Exhibit 49: Data Table on North America – Year-over-year growth 2021-2026 (%)
- 7.4 Europe – Market size and forecast 2021-2026
- Exhibit 50: Chart on Europe – Market size and forecast 2021-2026 ($ million)
- Exhibit 51: Data Table on Europe – Market size and forecast 2021-2026 ($ million)
- Exhibit 52: Chart on Europe – Year-over-year growth 2021-2026 (%)
- Exhibit 53: Data Table on Europe – Year-over-year growth 2021-2026 (%)
- 7.5 Asia – Market size and forecast 2021-2026
- Exhibit 54: Chart on Asia – Market size and forecast 2021-2026 ($ million)
- Exhibit 55: Data Table on Asia – Market size and forecast 2021-2026 ($ million)
- Exhibit 56: Chart on Asia – Year-over-year growth 2021-2026 (%)
- Exhibit 57: Data Table on Asia – Year-over-year growth 2021-2026 (%)
- 7.6 Rest of World (ROW) – Market size and forecast 2021-2026
- Exhibit 58: Chart on Rest of World (ROW) – Market size and forecast 2021-2026 ($ million)
- Exhibit 59: Data Table on Rest of World (ROW) – Market size and forecast 2021-2026 ($ million)
- Exhibit 60: Chart on Rest of World (ROW) – Year-over-year growth 2021-2026 (%)
- Exhibit 61: Data Table on Rest of World (ROW) – Year-over-year growth 2021-2026 (%)
- 7.7 US – Market size and forecast 2021-2026
- Exhibit 62: Chart on US – Market size and forecast 2021-2026 ($ million)
- Exhibit 63: Data Table on US – Market size and forecast 2021-2026 ($ million)
- Exhibit 64: Chart on US – Year-over-year growth 2021-2026 (%)
- Exhibit 65: Data Table on US – Year-over-year growth 2021-2026 (%)
- 7.8 Germany – Market size and forecast 2021-2026
- Exhibit 66: Chart on Germany – Market size and forecast 2021-2026 ($ million)
- Exhibit 67: Data Table on Germany – Market size and forecast 2021-2026 ($ million)
- Exhibit 68: Chart on Germany – Year-over-year growth 2021-2026 (%)
- Exhibit 69: Data Table on Germany – Year-over-year growth 2021-2026 (%)
- 7.9 China – Market size and forecast 2021-2026
- Exhibit 70: Chart on China – Market size and forecast 2021-2026 ($ million)
- Exhibit 71: Data Table on China – Market size and forecast 2021-2026 ($ million)
- Exhibit 72: Chart on China – Year-over-year growth 2021-2026 (%)
- Exhibit 73: Data Table on China – Year-over-year growth 2021-2026 (%)
- 7.10 UK – Market size and forecast 2021-2026
- Exhibit 74: Chart on UK – Market size and forecast 2021-2026 ($ million)
- Exhibit 75: Data Table on UK – Market size and forecast 2021-2026 ($ million)
- Exhibit 76: Chart on UK – Year-over-year growth 2021-2026 (%)
- Exhibit 77: Data Table on UK – Year-over-year growth 2021-2026 (%)
- 7.11 Canada – Market size and forecast 2021-2026
- Exhibit 78: Chart on Canada – Market size and forecast 2021-2026 ($ million)
- Exhibit 79: Data Table on Canada – Market size and forecast 2021-2026 ($ million)
- Exhibit 80: Chart on Canada – Year-over-year growth 2021-2026 (%)
- Exhibit 81: Data Table on Canada – Year-over-year growth 2021-2026 (%)
- 7.12 Market opportunity by geography
- Exhibit 82: Market opportunity by geography ($ million)
8 Drivers, Challenges, and Trends
- 8.1 Market drivers
- 8.2 Market challenges
- 8.3 Impact of drivers and challenges
- Exhibit 83: Impact of drivers and challenges in 2021 and 2026
- 8.4 Market trends
9 Vendor Landscape
- 9.1 Overview
- 9.2 Vendor landscape
- Exhibit 84: Overview on Criticality of inputs and Factors of differentiation
- 9.3 Landscape disruption
- Exhibit 85: Overview on factors of disruption
- 9.4 Industry risks
- Exhibit 86: Impact of key risks on business
10 Vendor Analysis
- 10.1 Vendors covered
- Exhibit 87: Vendors covered
- 10.2 Market positioning of vendors
- Exhibit 88: Matrix on vendor position and classification
- 10.3 Amplitude SAS
- Exhibit 89: Amplitude SAS – Overview
- Exhibit 90: Amplitude SAS – Product / Service
- Exhibit 91: Amplitude SAS – Key offerings
- 10.4 B. Braun SE
- Exhibit 92: B. Braun SE – Overview
- Exhibit 93: B. Braun SE – Business segments
- Exhibit 94: B. Braun SE – Key news
- Exhibit 95: B. Braun SE – Key offerings
- Exhibit 96: B. Braun SE – Segment focus
- 10.5 Conmed Corp.
- Exhibit 97: Conmed Corp. – Overview
- Exhibit 98: Conmed Corp. – Business segments
- Exhibit 99: Conmed Corp. – Key offerings
- Exhibit 100: Conmed Corp. – Segment focus
- 10.6 Globus Medical Inc.
- Exhibit 101: Globus Medical Inc. – Overview
- Exhibit 102: Globus Medical Inc. – Product / Service
- Exhibit 103: Globus Medical Inc. – Key offerings
- 10.7 Johnson and Johnson
- Exhibit 104: Johnson and Johnson – Overview
- Exhibit 105: Johnson and Johnson – Business segments
- Exhibit 106: Johnson and Johnson – Key news
- Exhibit 107: Johnson and Johnson – Key offerings
- Exhibit 108: Johnson and Johnson – Segment focus
- 10.8 Medtronic Plc
- Exhibit 109: Medtronic Plc – Overview
- Exhibit 110: Medtronic Plc – Business segments
- Exhibit 111: Medtronic Plc – Key news
- Exhibit 112: Medtronic Plc – Key offerings
- Exhibit 113: Medtronic Plc – Segment focus
- 10.9 Nuvasive Inc.
- Exhibit 114: Nuvasive Inc. – Overview
- Exhibit 115: Nuvasive Inc. – Business segments
- Exhibit 116: Nuvasive Inc. – Key news
- Exhibit 117: Nuvasive Inc. – Key offerings
- Exhibit 118: Nuvasive Inc. – Segment focus
- 10.10 Orthofix Medical Inc.
- Exhibit 119: Orthofix Medical Inc. – Overview
- Exhibit 120: Orthofix Medical Inc. – Business segments
- Exhibit 121: Orthofix Medical Inc. – Key news
- Exhibit 122: Orthofix Medical Inc. – Key offerings
- Exhibit 123: Orthofix Medical Inc. – Segment focus
- 10.11 Smith and Nephew plc
- Exhibit 124: Smith and Nephew plc – Overview
- Exhibit 125: Smith and Nephew plc – Business segments
- Exhibit 126: Smith and Nephew plc – Key news
- Exhibit 127: Smith and Nephew plc – Key offerings
- Exhibit 128: Smith and Nephew plc – Segment focus
- 10.12 Stryker Corp.
- Exhibit 129: Stryker Corp. – Overview
- Exhibit 130: Stryker Corp. – Business segments
- Exhibit 131: Stryker Corp. – Key news
- Exhibit 132: Stryker Corp. – Key offerings
- Exhibit 133: Stryker Corp. – Segment focus
11 Appendix
- 11.1 Scope of the report
- 11.2 Inclusions and exclusions checklist
- Exhibit 134: Inclusions checklist
- Exhibit 135: Exclusions checklist
- 11.3 Currency conversion rates for US$
- Exhibit 136: Currency conversion rates for US$
- 11.4 Research methodology
- Exhibit 137: Research methodology
- Exhibit 138: Validation techniques employed for market sizing
- Exhibit 139: Information sources
- 11.5 List of abbreviations
- Exhibit 140: List of abbreviations
About Us
Technavio is a leading global technology research and advisory company. Their research and analysis focus on emerging market trends and provide actionable insights to help businesses identify market opportunities and develop effective strategies to optimize their market positions. With over 500 specialized analysts, Technavio’s report library consists of more than 17,000 reports and counting, covering 800 technologies, spanning 50 countries. Their client base consists of enterprises of all sizes, including more than 100 Fortune 500 companies. This growing client base relies on Technavio’s comprehensive coverage, extensive research, and actionable market insights to identify opportunities in existing and potential markets and assess their competitive positions within changing market scenarios.
Contact
Technavio Research
Jesse Maida
Media & Marketing Executive
US: +1 844 364 1100
UK: +44 203 893 3200
Email: media@technavio.com
Website: www.technavio.com/
Newsroom:https://newsroom.technavio.com/news/orthopedic-implantsmarket
SOURCE Technavio