NEW YORK, Nov. 1, 2022 /PRNewswire/ — An increasing number of outpatient knee replacement surgeries is one of the key knee replacement market trends that is expected to impact the industry positively in the forecast period. The advances in surgical techniques, implants, multimodal pain management, and advances in postoperative care management are the primary reasons for the increasing preference for outpatient knee replacement surgeries. The average cost of an outpatient knee replacement was USD 8,500 lower than the cost of a knee replacement followed by a 3- to 4-day hospital stay. Outpatient knee implantation procedures also improve surgery outcomes as there is a reduced chance of contracting hospital-acquired infections. In the next decade, more than 50% of knee replacement surgeries are expected to be performed on an outpatient basis, which will boost the market growth in the forecast years.
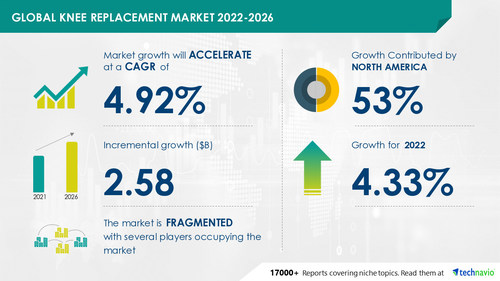
The knee replacement market size is expected to grow by USD 2.58 billion from 2021 to 2026. In addition, the growth momentum of the market will accelerate at a CAGR of 4.92% during the forecast period, according to Technavio. Technological advances and new product launches are driving the knee replacement market growth. However, factors such as high implant prices coupled with decreasing reimbursement may challenge market growth.
Get a comprehensive report summary that describes the market size and forecast along with research methodology. The FREE sample report is available in PDF format
Knee Replacement Market: Product Landscape
By product, the market has been segmented into TKR, RKR, and PKR. The TKR segment will be the largest contributor to market growth during the forecast period. It is the most common type of knee replacement surgery in which all three compartments of the knee joint, namely the thigh bone (femur), top of the shin bone (tibia), and the under-surface of the kneecap (patella), are replaced with joint implants. The rising incidence of orthopedic disorders among the aging population will drive the growth of the segment in the coming years.
Subscribe to our “Basic Plan” billed annually at USD 5000 that enables you to download 5 reports and view 100 reports per month
Knee Replacement Market: Geography Landscape
By geography, the market has been segmented into North America, Europe, APAC, and Rest of World (ROW). North America is going to have lucrative growth during the forecast period. About 53% of the market’s overall growth is expected to originate from the region. US, Canada, and Mexico are the key markets for knee replacement in North America. Market growth in this region will be faster than the growth of the market in Europe and ROW.
Learn about the contribution of each segment summarized in concise infographics and thorough descriptions. View a FREE PDF Sample Report
Knee Replacement Market: Key Companies and their Offerings
- B. Braun SE – The company offers knee replacement products such as the Vega system, Columbus knee system, and e.motion total knee system.
- Conformis Inc. – The company offers knee replacement products such as iTotal, iUni, and iDuo.
- DJO Global Inc.- the company offers knee ligament bracing, OA bracing, custom bracing, post-OP knee bracing, hinged knee bracing, and knee implants.
- Exactech Inc.- the company offers primary femoral stems, acetabular, revision femoral stems, and other hip replacement products.
- Johnson and Johnson – The company offers knee replacement products such as Attune knee system and Velys robotic system.
- Just HuaJian Medical Device Co. Ltd.
- Limacorporate Spa
- Medacta Group SA
- Merete Technologies Inc.
- MicroPort Scientific Corp.
- Smith and Nephew plc
- Stryker Corp.
- Waldemar Link GmbH and Co. KG
- Zimmer Biomet Holdings Inc.
- ADLER ORTHO S.p.A.
- Amplitude SAS
- Arthrex Inc.
- Fuse Medical Inc.
- implantcast GmbH
This report provides a full list of key vendors, their strategies, and the latest developments. Buy Now for detailed vendor information
What our reports offer:
- Market share assessments for the regional and country-level segments
- Strategic recommendations for the new entrants
- Covers market data for 2020, 2021, until 2025
- Market trends (drivers, opportunities, threats, challenges, investment opportunities, and recommendations)
- Strategic recommendations in key business segments based on the market estimations
- Competitive landscaping mapping the key common trends
- Company profiling with detailed strategies, financials, and recent developments
- Supply chain trends mapping the latest technological advancements
Related Reports:
Total Wrist Replacement Market by End-user and Geography – Forecast and Analysis 2022-2026: The total wrist replacement market share is expected to increase to USD 165.9 million from 2021 to 2026.
Heart Valve Repair and Replacement Devices Market by Product and Geography – Forecast and Analysis 2022-2026: The heart valve repair and replacement devices market share is expected to increase by USD 3.01 billion from 2021 to 2026.
| Knee Replacement Market Scope | |
| Report Coverage | Details |
| Page number | 120 |
| Base year | 2021 |
| Forecast period | 2022-2026 |
| Growth momentum & CAGR | Accelerate at a CAGR of 4.92% |
| Market growth 2022-2026 | USD 2.58 billion |
| Market structure | Fragmented |
| YoY growth (%) | 4.33 |
| Regional analysis | North America, Europe, Asia, and Rest of World (ROW) |
| Performing market contribution | North America at 53% |
| Key consumer countries | US, Canada, Mexico, Germany, France, and China |
| Competitive landscape | Leading companies, competitive strategies, consumer engagement scope |
| Companies profiled | ADLER ORTHO S.p.A., Amplitude SAS, Arthrex Inc., B. Braun SE, Conformis Inc., Corin Group Plc, DJO Global Inc., Exactech Inc., Fuse Medical Inc., implantcast GmbH, Johnson and Johnson, Just HuaJian Medical Device Co. Ltd., Limacorporate Spa, Medacta Group SA, Merete Technologies Inc., MicroPort Scientific Corp., Smith and Nephew plc, Stryker Corp., Waldemar Link GmbH and Co. KG, and Zimmer Biomet Holdings Inc. |
| Market Dynamics | Parent market analysis, Market growth inducers and obstacles, Fast-growing and slow-growing segment analysis, COVID-19 impact and future consumer dynamics, and market condition analysis for the forecast period. |
| Customization purview | If our report has not included the data that you are looking for, you can reach out to our analysts and get segments customized. |
Table of Contents:
1 Executive Summary
- 1.1 Market overview
- Exhibit 01: Executive Summary – Chart on Market Overview
- Exhibit 02: Executive Summary – Data Table on Market Overview
- Exhibit 03: Executive Summary – Chart on Global Market Characteristics
- Exhibit 04: Executive Summary – Chart on Market by Geography
- Exhibit 05: Executive Summary – Chart on Market Segmentation by Product
- Exhibit 06: Executive Summary – Chart on Incremental Growth
- Exhibit 07: Executive Summary – Data Table on Incremental Growth
- Exhibit 08: Executive Summary – Chart on Vendor Market Positioning
2 Market Landscape
- 2.1 Market ecosystem
- Exhibit 09: Parent market
- Exhibit 10: Market Characteristics
3 Market Sizing
- 3.1 Market Definition
- Exhibit 11: Offerings of vendors included in the market definition
- 3.2 Market segment analysis
- Exhibit 12: Market segments
- 3.3 Market size 2021
- 3.4 Market outlook: Forecast for 2021-2026
- Exhibit 13: Chart on Global – Market size and forecast 2021-2026 ($ million)
- Exhibit 14: Data Table on Global – Market size and forecast 2021-2026 ($ million)
- Exhibit 15: Chart on Global Market: Year-over-year growth 2021-2026 (%)
- Exhibit 16: Data Table on Global Market: Year-over-year growth 2021-2026 (%)
4 Five Forces Analysis
- 4.1 Five forces summary
- Exhibit 17: Five forces analysis – Comparison between 2021 and 2026
- 4.2 Bargaining power of buyers
- Exhibit 18: Chart on Bargaining power of buyers – Impact of key factors 2021 and 2026
- 4.3 Bargaining power of suppliers
- Exhibit 19: Bargaining power of suppliers – Impact of key factors in 2021 and 2026
- 4.4 Threat of new entrants
- Exhibit 20: Threat of new entrants – Impact of key factors in 2021 and 2026
- 4.5 Threat of substitutes
- Exhibit 21: Threat of substitutes – Impact of key factors in 2021 and 2026
- 4.6 Threat of rivalry
- Exhibit 22: Threat of rivalry – Impact of key factors in 2021 and 2026
- 4.7 Market condition
- Exhibit 23: Chart on Market condition – Five forces 2021 and 2026
5 Market Segmentation by Product
- 5.1 Market segments
- Exhibit 24: Chart on Product – Market share 2021-2026 (%)
- Exhibit 25: Data Table on Product – Market share 2021-2026 (%)
- 5.2 Comparison by Product
- Exhibit 26: Chart on Comparison by Product
- Exhibit 27: Data Table on Comparison by Product
- 5.3 TKR – Market size and forecast 2021-2026
- Exhibit 28: Chart on TKR – Market size and forecast 2021-2026 ($ million)
- Exhibit 29: Data Table on TKR – Market size and forecast 2021-2026 ($ million)
- Exhibit 30: Chart on TKR – Year-over-year growth 2021-2026 (%)
- Exhibit 31: Data Table on TKR – Year-over-year growth 2021-2026 (%)
- 5.4 RKR – Market size and forecast 2021-2026
- Exhibit 32: Chart on RKR – Market size and forecast 2021-2026 ($ million)
- Exhibit 33: Data Table on RKR – Market size and forecast 2021-2026 ($ million)
- Exhibit 34: Chart on RKR – Year-over-year growth 2021-2026 (%)
- Exhibit 35: Data Table on RKR – Year-over-year growth 2021-2026 (%)
- 5.5 PKR – Market size and forecast 2021-2026
- Exhibit 36: Chart on PKR – Market size and forecast 2021-2026 ($ million)
- Exhibit 37: Data Table on PKR – Market size and forecast 2021-2026 ($ million)
- Exhibit 38: Chart on PKR – Year-over-year growth 2021-2026 (%)
- Exhibit 39: Data Table on PKR – Year-over-year growth 2021-2026 (%)
- 5.6 Market opportunity by Product
- Exhibit 40: Market opportunity by Product ($ million)
6 Customer Landscape
- 6.1 Customer landscape overview
- Exhibit 41: Analysis of price sensitivity, lifecycle, customer purchase basket, adoption rates, and purchase criteria
7 Geographic Landscape
- 7.1 Geographic segmentation
- Exhibit 42: Chart on Market share by geography 2021-2026 (%)
- Exhibit 43: Data Table on Market share by geography 2021-2026 (%)
- 7.2 Geographic comparison
- Exhibit 44: Chart on Geographic comparison
- Exhibit 45: Data Table on Geographic comparison
- 7.3 North America – Market size and forecast 2021-2026
- Exhibit 46: Chart on North America – Market size and forecast 2021-2026 ($ million)
- Exhibit 47: Data Table on North America – Market size and forecast 2021-2026 ($ million)
- Exhibit 48: Chart on North America – Year-over-year growth 2021-2026 (%)
- Exhibit 49: Data Table on North America – Year-over-year growth 2021-2026 (%)
- 7.4 Europe – Market size and forecast 2021-2026
- Exhibit 50: Chart on Europe – Market size and forecast 2021-2026 ($ million)
- Exhibit 51: Data Table on Europe – Market size and forecast 2021-2026 ($ million)
- Exhibit 52: Chart on Europe – Year-over-year growth 2021-2026 (%)
- Exhibit 53: Data Table on Europe – Year-over-year growth 2021-2026 (%)
- 7.5 Asia – Market size and forecast 2021-2026
- Exhibit 54: Chart on Asia – Market size and forecast 2021-2026 ($ million)
- Exhibit 55: Data Table on Asia – Market size and forecast 2021-2026 ($ million)
- Exhibit 56: Chart on Asia – Year-over-year growth 2021-2026 (%)
- Exhibit 57: Data Table on Asia – Year-over-year growth 2021-2026 (%)
- 7.6 Rest of World (ROW) – Market size and forecast 2021-2026
- Exhibit 58: Chart on Rest of World (ROW) – Market size and forecast 2021-2026 ($ million)
- Exhibit 59: Data Table on Rest of World (ROW) – Market size and forecast 2021-2026 ($ million)
- Exhibit 60: Chart on Rest of World (ROW) – Year-over-year growth 2021-2026 (%)
- Exhibit 61: Data Table on Rest of World (ROW) – Year-over-year growth 2021-2026 (%)
- 7.7 US – Market size and forecast 2021-2026
- Exhibit 62: Chart on US – Market size and forecast 2021-2026 ($ million)
- Exhibit 63: Data Table on US – Market size and forecast 2021-2026 ($ million)
- Exhibit 64: Chart on US – Year-over-year growth 2021-2026 (%)
- Exhibit 65: Data Table on US – Year-over-year growth 2021-2026 (%)
- 7.8 Canada – Market size and forecast 2021-2026
- Exhibit 66: Chart on Canada – Market size and forecast 2021-2026 ($ million)
- Exhibit 67: Data Table on Canada – Market size and forecast 2021-2026 ($ million)
- Exhibit 68: Chart on Canada – Year-over-year growth 2021-2026 (%)
- Exhibit 69: Data Table on Canada – Year-over-year growth 2021-2026 (%)
- 7.9 Germany – Market size and forecast 2021-2026
- Exhibit 70: Chart on Germany – Market size and forecast 2021-2026 ($ million)
- Exhibit 71: Data Table on Germany – Market size and forecast 2021-2026 ($ million)
- Exhibit 72: Chart on Germany – Year-over-year growth 2021-2026 (%)
- Exhibit 73: Data Table on Germany – Year-over-year growth 2021-2026 (%)
- 7.10 China – Market size and forecast 2021-2026
- Exhibit 74: Chart on China – Market size and forecast 2021-2026 ($ million)
- Exhibit 75: Data Table on China – Market size and forecast 2021-2026 ($ million)
- Exhibit 76: Chart on China – Year-over-year growth 2021-2026 (%)
- Exhibit 77: Data Table on China – Year-over-year growth 2021-2026 (%)
- 7.11 France – Market size and forecast 2021-2026
- Exhibit 78: Chart on France – Market size and forecast 2021-2026 ($ million)
- Exhibit 79: Data Table on France – Market size and forecast 2021-2026 ($ million)
- Exhibit 80: Chart on France – Year-over-year growth 2021-2026 (%)
- Exhibit 81: Data Table on France – Year-over-year growth 2021-2026 (%)
- 7.12 Mexico – Market size and forecast 2021-2026
- Exhibit 82: Chart on Mexico – Market size and forecast 2021-2026 ($ million)
- Exhibit 83: Data Table on Mexico – Market size and forecast 2021-2026 ($ million)
- Exhibit 84: Chart on Mexico – Year-over-year growth 2021-2026 (%)
- Exhibit 85: Data Table on Mexico – Year-over-year growth 2021-2026 (%)
- 7.13 Market opportunity by geography
- Exhibit 86: Market opportunity by geography ($ million)
8 Drivers, Challenges, and Trends
- 8.1 Market drivers
- 8.2 Market challenges
- 8.3 Impact of drivers and challenges
- Exhibit 87: Impact of drivers and challenges in 2021 and 2026
- 8.4 Market trends
9 Vendor Landscape
- 9.1 Overview
- 9.2 Vendor landscape
- Exhibit 88: Overview on Criticality of inputs and Factors of differentiation
- 9.3 Landscape disruption
- Exhibit 89: Overview on factors of disruption
- 9.4 Industry risks
- Exhibit 90: Impact of key risks on business
10 Vendor Analysis
- 10.1 Vendors covered
- Exhibit 91: Vendors covered
- 10.2 Market positioning of vendors
- Exhibit 92: Matrix on vendor position and classification
- 10.3 B. Braun SE
- Exhibit 93: B. Braun SE – Overview
- Exhibit 94: B. Braun SE – Business segments
- Exhibit 95: B. Braun SE – Key news
- Exhibit 96: B. Braun SE – Key offerings
- Exhibit 97: B. Braun SE – Segment focus
- 10.4 Conformis Inc.
- Exhibit 98: Conformis Inc. – Overview
- Exhibit 99: Conformis Inc. – Product / Service
- Exhibit 100: Conformis Inc. – Key news
- Exhibit 101: Conformis Inc. – Key offerings
- 10.5 Corin Group Plc
- Exhibit 102: Corin Group Plc – Overview
- Exhibit 103: Corin Group Plc – Product / Service
- Exhibit 104: Corin Group Plc – Key offerings
- 10.6 Exactech Inc.
- Exhibit 105: Exactech Inc. – Overview
- Exhibit 106: Exactech Inc. – Product / Service
- Exhibit 107: Exactech Inc. – Key offerings
- 10.7 Johnson and Johnson
- Exhibit 108: Johnson and Johnson – Overview
- Exhibit 109: Johnson and Johnson – Business segments
- Exhibit 110: Johnson and Johnson – Key news
- Exhibit 111: Johnson and Johnson – Key offerings
- Exhibit 112: Johnson and Johnson – Segment focus
- 10.8 Medacta Group SA
- Exhibit 113: Medacta Group SA – Overview
- Exhibit 114: Medacta Group SA – Product / Service
- Exhibit 115: Medacta Group SA – Key offerings
- 10.9 MicroPort Scientific Corp.
- Exhibit 116: MicroPort Scientific Corp. – Overview
- Exhibit 117: MicroPort Scientific Corp. – Business segments
- Exhibit 118: MicroPort Scientific Corp. – Key offerings
- Exhibit 119: MicroPort Scientific Corp. – Segment focus
- 10.10 Smith and Nephew plc
- Exhibit 120: Smith and Nephew plc – Overview
- Exhibit 121: Smith and Nephew plc – Business segments
- Exhibit 122: Smith and Nephew plc – Key news
- Exhibit 123: Smith and Nephew plc – Key offerings
- Exhibit 124: Smith and Nephew plc – Segment focus
- 10.11 Stryker Corp.
- Exhibit 125: Stryker Corp. – Overview
- Exhibit 126: Stryker Corp. – Business segments
- Exhibit 127: Stryker Corp. – Key news
- Exhibit 128: Stryker Corp. – Key offerings
- Exhibit 129: Stryker Corp. – Segment focus
- 10.12 Zimmer Biomet Holdings Inc.
- Exhibit 130: Zimmer Biomet Holdings Inc. – Overview
- Exhibit 131: Zimmer Biomet Holdings Inc. – Business segments
- Exhibit 132: Zimmer Biomet Holdings Inc. – Key news
- Exhibit 133: Zimmer Biomet Holdings Inc. – Key offerings
- Exhibit 134: Zimmer Biomet Holdings Inc. – Segment focus
11 Appendix
- 11.1 Scope of the report
- 11.2 Inclusions and exclusions checklist
- Exhibit 135: Inclusions checklist
- Exhibit 136: Exclusions checklist
- 11.3 Currency conversion rates for US$
- Exhibit 137: Currency conversion rates for US$
- 11.4 Research methodology
- Exhibit 138: Research methodology
- Exhibit 139: Validation techniques employed for market sizing
- Exhibit 140: Information sources
- 11.5 List of abbreviations
- Exhibit 141: List of abbreviations
About Us
Technavio is a leading global technology research and advisory company. Their research and analysis focus on emerging market trends and provide actionable insights to help businesses identify market opportunities and develop effective strategies to optimize their market positions. With over 500 specialized analysts, Technavio’s report library consists of more than 17,000 reports and counting, covering 800 technologies, spanning 50 countries. Their client base consists of enterprises of all sizes, including more than 100 Fortune 500 companies. This growing client base relies on Technavio’s comprehensive coverage, extensive research, and actionable market insights to identify opportunities in existing and potential markets and assess their competitive positions within changing market scenarios.
Contact
Technavio Research
Jesse Maida
Media & Marketing Executive
US: +1 844 364 1100
UK: +44 203 893 3200
Email: media@technavio.com
Website: www.technavio.com/
SOURCE Technavio