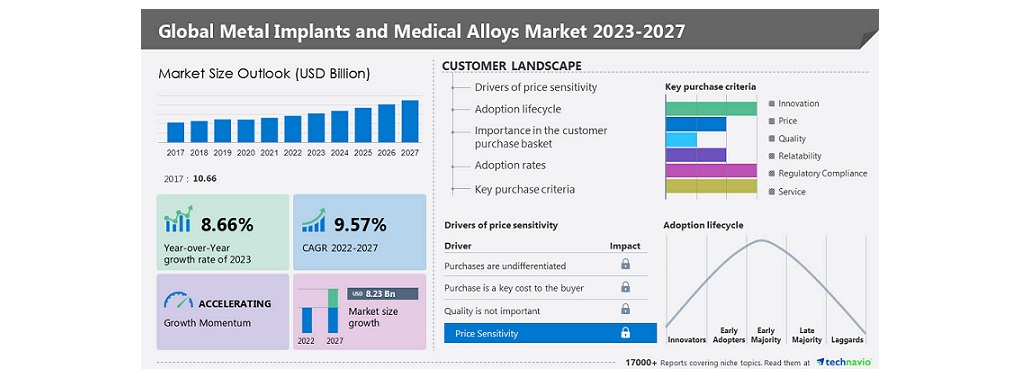
NEW YORK, March 27, 2023 /PRNewswire/ — The global metal implants and medical alloys market size is estimated to grow by USD 8.23 billion from 2022 to 2027, according to Technavio. The market is estimated to grow at a CAGR of 9.57% during the forecast period. The market is driven by the high demand for orthopedic implants. The rise in the aging population in North America, Europe, and Japan has increased the number of patients undergoing joint replacement surgeries. The number of orthopedic surgeries such as complete hip and knee replacement has gradually increased. Also, the rising frequency of osteoporosis-related fractures and musculoskeletal diagnoses is increasing the demand for orthopedic implants. All these factors are driving the growth of the market. Discover some insights on market size historic period (2017 to 2021) and Forecast (2023 to 2027) before buying the full report – Request a sample report.
Global Metal Implants and Medical Alloys Market – Vendor Analysis
The global metal implants and medical alloys market is highly fragmented due to the presence of numerous vendors at the global, regional, and local levels. To stay competitive in the market, many large vendors are opting for mergers and acquisitions (M&As). Also, vendors are differentiating themselves through value-added services and pricing. A few prominent vendors that offer metal implants and medical alloys in the market are:
- aap Implantate AG – The company offers LOQTEQ plating system, which is designed for applications related to the surgical process.
- AMETEK Inc. – The company offers precision strips that are designed to be used for implantable devices such as pacemakers and neurostimulator enclosures.
- Aperam SA – The company offers PHYNOX austenitic alloy, which is designed for numerous applications related to surgical implants, metrology, electronics, and aeronautical engineering.
- Carpenter Technology Corp. – The company offers Biodur 316LS metal alloy, which is designed for application in fracture fixation devices such as bone plates, screws, and intramedullary nails.
What’s New? –
- Special coverage on the Russia-Ukraine war; global inflation; recovery analysis from COVID-19; supply chain disruptions, global trade tensions; and risk of recession
- Global competitiveness and key competitor positions
- Market presence across multiple geographical footprints – Strong/Active/Niche/Trivial – Buy the report!
Global Metal Implants and Medical Alloys Market – Segmentation Assessment
Segment Overview
Technavio has segmented the market based on type (titanium, stainless steel, cobalt-chromium, and others) and application (orthopedic, cardiovascular, dental, craniofacial, and others).
- The market growth in the titanium segment will be significant during the forecast period. Titanium 6AL-4V/Titanium 6Al4V ELI alpha-beta alloys are among the most popular alloys used in medical and dental implants. These alloys improve osseointegration by providing a high level of fracture resistance and working effectively inside the body. These factors are driving the growth of the segment.
Geography Overview
By geography, the global metal implants and medical alloys market is segmented into North America, APAC, Europe, Middle East and Africa, and South America. The report provides actionable insights and estimates the contribution of all regions to the growth of the global metal implants and medical alloys market.
- North America will account for 30% of the market growth during the forecast period. The rising demand for medical implants and the availability of skilled medical professionals are major factors driving the growth of the regional market. In addition, factors such as the increasing number of patients undergoing knee and hip replacement surgery, the presence of well-established insurance and reimbursement frameworks, and the presence of advanced healthcare infrastructure are supporting the growth of the metal implants and medical alloys market in North America.
For insights on global, regional, and country-level parameters with growth opportunities
from 2017 to 2027 – Download a Sample Report
Global Metal Implants and Medical Alloys Market – Market Dynamics
Key Trends –
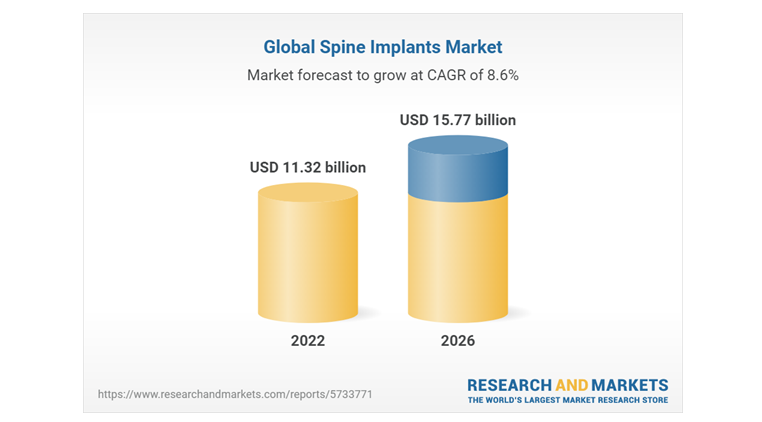
The increasing adoption of minimally invasive procedures is one of the major trends in the market. The incidence of surgical-site infections is more likely to happen in open surgeries. Hence, patients are increasingly preferring minimally invasive surgeries. Compared to open surgeries, minimally invasive surgical methods are safer, less stressful, and have lower mortality and complication rates. Reduced surgical risks, less pain and blood loss, lower chances of infection, and shorter postoperative recovery times are some of the benefits of minimally invasive surgeries. Herniated discs, degenerative spinal diseases, fractures, trauma, and other conditions can be treated using minimally invasive surgical procedures. Hence, minimally invasive procedures are becoming more popular among patients and healthcare providers.
Major challenges –
The high cost of implants is a major challenge hindering the growth of the market. The cost of metal implants increases across the value chain, which increases the cost burden on patients. Also, the cost of surgery depends on the type of condition and procedure. For instance, the average cost of inpatient orthopedic procedures ranges between USD 25,000 and USD 30,000, and the average cost of outpatient surgeries ranges between USD 15,000 and USD 20,000. In addition, repeated tests can increase the cost burden on patients. Such factors are reducing the growth potential in the market.
Drivers, trends, and challenges have an impact on market dynamics, which can impact
businesses. Find more insights in a sample report!
What are the key data covered in this metal implants and medical alloys market report?
- CAGR of the market during the forecast period
- Detailed information on factors that will drive the growth of the metal implants and medical alloys market between 2023 and 2027
- Precise estimation of the size of the metal implants and medical alloys market and its contribution to the parent market
- Accurate predictions about upcoming trends and changes in consumer behavior
- Growth of the metal implants and medical alloys market industry across North America, APAC, Europe, Middle East and Africa, and South America
- A thorough analysis of the market’s competitive landscape and detailed information about vendors
- Comprehensive analysis of factors that will challenge the growth of metal implants and medical alloys market vendors
Gain instant access to 17,000+ market research reports.
Technavio’s SUBSCRIPTION platform
Related Reports:
- The digit joint implants market is estimated to grow at a CAGR of 7.49% between 2022 and 2027. The size of the market is forecast to increase by USD 60.48 million. The increasing incidence of osteoarthritis is notably driving the market growth, although factors such as complications associated with the use of digit joint implants may impede the market growth.
- The dental implants market has the potential to grow by USD 1.27 billion during 2021-2026, and the market’s growth momentum will accelerate at a CAGR of 4.99%. The increasing number of cosmetic dentistry and orthodontic treatments is notably driving the dental implants market growth, although factors such as the high cost of dental implants and implant procedures may impede the market growth.
| Metal Implants and Medical Alloys Market Scope | |
| Report Coverage | Details |
| Base year | 2022 |
| Historic period | 2017-2021 |
| Forecast period | 2023-2027 |
| Growth momentum & CAGR | Accelerate at a CAGR of 9.57% |
| Market growth 2023-2027 | USD 8.23 billion |
| Market structure | Fragmented |
| YoY growth 2022-2023 (%) | 8.66 |
| Regional analysis | North America, APAC, Europe, Middle East and Africa, and South America |
| Performing market contribution | North America at 30% |
| Key countries | US, China, Japan, France, and UK |
| Competitive landscape | Leading Vendors, Market Positioning of Vendors, Competitive Strategies, and Industry Risks |
| Key companies profiled | aap Implantate AG, Allegheny Technologies Inc., AMETEK Inc., Anomet Products Inc., Aperam SA, Arthrex Inc., Boston Centerless Inc., Carpenter Technology Corp., Fort Wayne Metals Research Products LLC, Johnson and Johnson Services Inc., Johnson Matthey Plc, Koninklijke DSM NV, Materion Corp., Prince Izant Co., SAES Getters Spa, Supra Alloys, Ugitech SA, Zimmer Biomet Holdings Inc., O Neal Industries, and Stryker Corp. |
| Market dynamics | Parent market analysis, market growth inducers and obstacles, fast-growing and slow-growing segment analysis, COVID-19 impact and recovery analysis and future consumer dynamics, and market condition analysis for the forecast period. |
| Customization purview | If our report has not included the data that you are looking for, you can reach out to our analysts and get segments customized. |
Browse through Technavio’s Health Care Market Reports
Table of contents:
1 Executive Summary
- 1.1 Market overview
- Exhibit 01: Executive Summary – Chart on Market Overview
- Exhibit 02: Executive Summary – Data Table on Market Overview
- Exhibit 03: Executive Summary – Chart on Global Market Characteristics
- Exhibit 04: Executive Summary – Chart on Market by Geography
- Exhibit 05: Executive Summary – Chart on Market Segmentation by Type
- Exhibit 06: Executive Summary – Chart on Market Segmentation by Application
- Exhibit 07: Executive Summary – Chart on Incremental Growth
- Exhibit 08: Executive Summary – Data Table on Incremental Growth
- Exhibit 09: Executive Summary – Chart on Vendor Market Positioning
2 Market Landscape
- 2.1 Market ecosystem
- Exhibit 10: Parent market
- Exhibit 11: Market Characteristics
3 Market Sizing
- 3.1 Market definition
- Exhibit 12: Offerings of vendors included in the market definition
- 3.2 Market segment analysis
- Exhibit 13: Market segments
- 3.3 Market size 2022
- 3.4 Market outlook: Forecast for 2022-2027
- Exhibit 14: Chart on Global – Market size and forecast 2022-2027 ($ billion)
- Exhibit 15: Data Table on Global – Market size and forecast 2022-2027 ($ billion)
- Exhibit 16: Chart on Global Market: Year-over-year growth 2022-2027 (%)
- Exhibit 17: Data Table on Global Market: Year-over-year growth 2022-2027 (%)
4 Historic Market Size
- 4.1 Global metal implants and medical alloys market 2017 – 2021
- Exhibit 18: Historic Market Size – Data Table on Global metal implants and medical alloys market 2017 – 2021 ($ billion)
- 4.2 Type Segment Analysis 2017 – 2021
- Exhibit 19: Historic Market Size – Type Segment 2017 – 2021 ($ billion)
- 4.3 Application Segment Analysis 2017 – 2021
- Exhibit 20: Historic Market Size – Application Segment 2017 – 2021 ($ billion)
- 4.4 Geography Segment Analysis 2017 – 2021
- Exhibit 21: Historic Market Size – Geography Segment 2017 – 2021 ($ billion)
- 4.5 Country Segment Analysis 2017 – 2021
- Exhibit 22: Historic Market Size – Country Segment 2017 – 2021 ($ billion)
5 Five Forces Analysis
- 5.1 Five forces summary
- Exhibit 23: Five forces analysis – Comparison between 2022 and 2027
- 5.2 Bargaining power of buyers
- Exhibit 24: Chart on Bargaining power of buyers – Impact of key factors 2022 and 2027
- 5.3 Bargaining power of suppliers
- Exhibit 25: Bargaining power of suppliers – Impact of key factors in 2022 and 2027
- 5.4 Threat of new entrants
- Exhibit 26: Threat of new entrants – Impact of key factors in 2022 and 2027
- 5.5 Threat of substitutes
- Exhibit 27: Threat of substitutes – Impact of key factors in 2022 and 2027
- 5.6 Threat of rivalry
- Exhibit 28: Threat of rivalry – Impact of key factors in 2022 and 2027
- 5.7 Market condition
- Exhibit 29: Chart on Market condition – Five forces 2022 and 2027
6 Market Segmentation by Type
- 6.1 Market segments
- Exhibit 30: Chart on Type – Market share 2022-2027 (%)
- Exhibit 31: Data Table on Type – Market share 2022-2027 (%)
- 6.2 Comparison by Type
- Exhibit 32: Chart on Comparison by Type
- Exhibit 33: Data Table on Comparison by Type
- 6.3 Titanium – Market size and forecast 2022-2027
- Exhibit 34: Chart on Titanium – Market size and forecast 2022-2027 ($ billion)
- Exhibit 35: Data Table on Titanium – Market size and forecast 2022-2027 ($ billion)
- Exhibit 36: Chart on Titanium – Year-over-year growth 2022-2027 (%)
- Exhibit 37: Data Table on Titanium – Year-over-year growth 2022-2027 (%)
- 6.4 Stainless steel – Market size and forecast 2022-2027
- Exhibit 38: Chart on Stainless steel – Market size and forecast 2022-2027 ($ billion)
- Exhibit 39: Data Table on Stainless steel – Market size and forecast 2022-2027 ($ billion)
- Exhibit 40: Chart on Stainless steel – Year-over-year growth 2022-2027 (%)
- Exhibit 41: Data Table on Stainless steel – Year-over-year growth 2022-2027 (%)
- 6.5 Cobalt-chromium – Market size and forecast 2022-2027
- Exhibit 42: Chart on Cobalt-chromium – Market size and forecast 2022-2027 ($ billion)
- Exhibit 43: Data Table on Cobalt-chromium – Market size and forecast 2022-2027 ($ billion)
- Exhibit 44: Chart on Cobalt-chromium – Year-over-year growth 2022-2027 (%)
- Exhibit 45: Data Table on Cobalt-chromium – Year-over-year growth 2022-2027 (%)
- 6.6 Others – Market size and forecast 2022-2027
- Exhibit 46: Chart on Others – Market size and forecast 2022-2027 ($ billion)
- Exhibit 47: Data Table on Others – Market size and forecast 2022-2027 ($ billion)
- Exhibit 48: Chart on Others – Year-over-year growth 2022-2027 (%)
- Exhibit 49: Data Table on Others – Year-over-year growth 2022-2027 (%)
- 6.7 Market opportunity by Type
- Exhibit 50: Market opportunity by Type ($ billion)
7 Market Segmentation by Application
- 7.1 Market segments
- Exhibit 51: Chart on Application – Market share 2022-2027 (%)
- Exhibit 52: Data Table on Application – Market share 2022-2027 (%)
- 7.2 Comparison by Application
- Exhibit 53: Chart on Comparison by Application
- Exhibit 54: Data Table on Comparison by Application
- 7.3 Orthopedic – Market size and forecast 2022-2027
- Exhibit 55: Chart on Orthopedic – Market size and forecast 2022-2027 ($ billion)
- Exhibit 56: Data Table on Orthopedic – Market size and forecast 2022-2027 ($ billion)
- Exhibit 57: Chart on Orthopedic – Year-over-year growth 2022-2027 (%)
- Exhibit 58: Data Table on Orthopedic – Year-over-year growth 2022-2027 (%)
- 7.4 Cardiovascular – Market size and forecast 2022-2027
- Exhibit 59: Chart on Cardiovascular – Market size and forecast 2022-2027 ($ billion)
- Exhibit 60: Data Table on Cardiovascular – Market size and forecast 2022-2027 ($ billion)
- Exhibit 61: Chart on Cardiovascular – Year-over-year growth 2022-2027 (%)
- Exhibit 62: Data Table on Cardiovascular – Year-over-year growth 2022-2027 (%)
- 7.5 Dental – Market size and forecast 2022-2027
- Exhibit 63: Chart on Dental – Market size and forecast 2022-2027 ($ billion)
- Exhibit 64: Data Table on Dental – Market size and forecast 2022-2027 ($ billion)
- Exhibit 65: Chart on Dental – Year-over-year growth 2022-2027 (%)
- Exhibit 66: Data Table on Dental – Year-over-year growth 2022-2027 (%)
- 7.6 Craniofacial – Market size and forecast 2022-2027
- Exhibit 67: Chart on Craniofacial – Market size and forecast 2022-2027 ($ billion)
- Exhibit 68: Data Table on Craniofacial – Market size and forecast 2022-2027 ($ billion)
- Exhibit 69: Chart on Craniofacial – Year-over-year growth 2022-2027 (%)
- Exhibit 70: Data Table on Craniofacial – Year-over-year growth 2022-2027 (%)
- 7.7 Others – Market size and forecast 2022-2027
- Exhibit 71: Chart on Others – Market size and forecast 2022-2027 ($ billion)
- Exhibit 72: Data Table on Others – Market size and forecast 2022-2027 ($ billion)
- Exhibit 73: Chart on Others – Year-over-year growth 2022-2027 (%)
- Exhibit 74: Data Table on Others – Year-over-year growth 2022-2027 (%)
- 7.8 Market opportunity by Application
- Exhibit 75: Market opportunity by Application ($ billion)
8 Customer Landscape
- 8.1 Customer landscape overview
- Exhibit 76: Analysis of price sensitivity, lifecycle, customer purchase basket, adoption rates, and purchase criteria
9 Geographic Landscape
- 9.1 Geographic segmentation
- Exhibit 77: Chart on Market share by geography 2022-2027 (%)
- Exhibit 78: Data Table on Market share by geography 2022-2027 (%)
- 9.2 Geographic comparison
- Exhibit 79: Chart on Geographic comparison
- Exhibit 80: Data Table on Geographic comparison
- 9.3 North America – Market size and forecast 2022-2027
- Exhibit 81: Chart on North America – Market size and forecast 2022-2027 ($ billion)
- Exhibit 82: Data Table on North America – Market size and forecast 2022-2027 ($ billion)
- Exhibit 83: Chart on North America – Year-over-year growth 2022-2027 (%)
- Exhibit 84: Data Table on North America – Year-over-year growth 2022-2027 (%)
- 9.4 APAC – Market size and forecast 2022-2027
- Exhibit 85: Chart on APAC – Market size and forecast 2022-2027 ($ billion)
- Exhibit 86: Data Table on APAC – Market size and forecast 2022-2027 ($ billion)
- Exhibit 87: Chart on APAC – Year-over-year growth 2022-2027 (%)
- Exhibit 88: Data Table on APAC – Year-over-year growth 2022-2027 (%)
- 9.5 Europe – Market size and forecast 2022-2027
- Exhibit 89: Chart on Europe – Market size and forecast 2022-2027 ($ billion)
- Exhibit 90: Data Table on Europe – Market size and forecast 2022-2027 ($ billion)
- Exhibit 91: Chart on Europe – Year-over-year growth 2022-2027 (%)
- Exhibit 92: Data Table on Europe – Year-over-year growth 2022-2027 (%)
- 9.6 Middle East and Africa – Market size and forecast 2022-2027
- Exhibit 93: Chart on Middle East and Africa – Market size and forecast 2022-2027 ($ billion)
- Exhibit 94: Data Table on Middle East and Africa – Market size and forecast 2022-2027 ($ billion)
- Exhibit 95: Chart on Middle East and Africa – Year-over-year growth 2022-2027 (%)
- Exhibit 96: Data Table on Middle East and Africa – Year-over-year growth 2022-2027 (%)
- 9.7 South America – Market size and forecast 2022-2027
- Exhibit 97: Chart on South America – Market size and forecast 2022-2027 ($ billion)
- Exhibit 98: Data Table on South America – Market size and forecast 2022-2027 ($ billion)
- Exhibit 99: Chart on South America – Year-over-year growth 2022-2027 (%)
- Exhibit 100: Data Table on South America – Year-over-year growth 2022-2027 (%)
- 9.8 US – Market size and forecast 2022-2027
- Exhibit 101: Chart on US – Market size and forecast 2022-2027 ($ billion)
- Exhibit 102: Data Table on US – Market size and forecast 2022-2027 ($ billion)
- Exhibit 103: Chart on US – Year-over-year growth 2022-2027 (%)
- Exhibit 104: Data Table on US – Year-over-year growth 2022-2027 (%)
- 9.9 China – Market size and forecast 2022-2027
- Exhibit 105: Chart on China – Market size and forecast 2022-2027 ($ billion)
- Exhibit 106: Data Table on China – Market size and forecast 2022-2027 ($ billion)
- Exhibit 107: Chart on China – Year-over-year growth 2022-2027 (%)
- Exhibit 108: Data Table on China – Year-over-year growth 2022-2027 (%)
- 9.10 France – Market size and forecast 2022-2027
- Exhibit 109: Chart on France – Market size and forecast 2022-2027 ($ billion)
- Exhibit 110: Data Table on France – Market size and forecast 2022-2027 ($ billion)
- Exhibit 111: Chart on France – Year-over-year growth 2022-2027 (%)
- Exhibit 112: Data Table on France – Year-over-year growth 2022-2027 (%)
- 9.11 Japan – Market size and forecast 2022-2027
- Exhibit 113: Chart on Japan – Market size and forecast 2022-2027 ($ billion)
- Exhibit 114: Data Table on Japan – Market size and forecast 2022-2027 ($ billion)
- Exhibit 115: Chart on Japan – Year-over-year growth 2022-2027 (%)
- Exhibit 116: Data Table on Japan – Year-over-year growth 2022-2027 (%)
- 9.12 UK – Market size and forecast 2022-2027
- Exhibit 117: Chart on UK – Market size and forecast 2022-2027 ($ billion)
- Exhibit 118: Data Table on UK – Market size and forecast 2022-2027 ($ billion)
- Exhibit 119: Chart on UK – Year-over-year growth 2022-2027 (%)
- Exhibit 120: Data Table on UK – Year-over-year growth 2022-2027 (%)
- 9.13 Market opportunity by geography
- Exhibit 121: Market opportunity by geography ($ billion)
10 Drivers, Challenges, and Trends
- 10.1 Market drivers
- 10.2 Market challenges
- 10.3 Impact of drivers and challenges
- Exhibit 122: Impact of drivers and challenges in 2022 and 2027
- 10.4 Market trends
11 Vendor Landscape
- 11.1 Overview
- 11.2 Vendor landscape
- Exhibit 123: Overview on Criticality of inputs and Factors of differentiation
- 11.3 Landscape disruption
- Exhibit 124: Overview on factors of disruption
- 11.4 Industry risks
- Exhibit 125: Impact of key risks on business
12 Vendor Analysis
- 12.1 Vendors covered
- Exhibit 126: Vendors covered
- 12.2 Market positioning of vendors
- Exhibit 127: Matrix on vendor position and classification
- 12.3 aap Implantate AG
- Exhibit 128: aap Implantate AG – Overview
- Exhibit 129: aap Implantate AG – Product / Service
- Exhibit 130: aap Implantate AG – Key offerings
- 12.4 Allegheny Technologies Inc.
- Exhibit 131: Allegheny Technologies Inc. – Overview
- Exhibit 132: Allegheny Technologies Inc. – Business segments
- Exhibit 133: Allegheny Technologies Inc. – Key news
- Exhibit 134: Allegheny Technologies Inc. – Key offerings
- Exhibit 135: Allegheny Technologies Inc. – Segment focus
- 12.5 AMETEK Inc.
- Exhibit 136: AMETEK Inc. – Overview
- Exhibit 137: AMETEK Inc. – Business segments
- Exhibit 138: AMETEK Inc. – Key offerings
- Exhibit 139: AMETEK Inc. – Segment focus
- 12.6 Aperam SA
- Exhibit 140: Aperam SA – Overview
- Exhibit 141: Aperam SA – Business segments
- Exhibit 142: Aperam SA – Key offerings
- Exhibit 143: Aperam SA – Segment focus
- 12.7 Arthrex Inc.
- Exhibit 144: Arthrex Inc. – Overview
- Exhibit 145: Arthrex Inc. – Product / Service
- Exhibit 146: Arthrex Inc. – Key offerings
- 12.8 Carpenter Technology Corp.
- Exhibit 147: Carpenter Technology Corp. – Overview
- Exhibit 148: Carpenter Technology Corp. – Business segments
- Exhibit 149: Carpenter Technology Corp. – Key offerings
- Exhibit 150: Carpenter Technology Corp. – Segment focus
- 12.9 Fort Wayne Metals Research Products LLC
- Exhibit 151: Fort Wayne Metals Research Products LLC – Overview
- Exhibit 152: Fort Wayne Metals Research Products LLC – Product / Service
- Exhibit 153: Fort Wayne Metals Research Products LLC – Key offerings
- 12.10 Johnson Matthey Plc
- Exhibit 154: Johnson Matthey Plc – Overview
- Exhibit 155: Johnson Matthey Plc – Business segments
- Exhibit 156: Johnson Matthey Plc – Key offerings
- Exhibit 157: Johnson Matthey Plc – Segment focus
- 12.11 Koninklijke DSM NV
- Exhibit 158: Koninklijke DSM NV – Overview
- Exhibit 159: Koninklijke DSM NV – Business segments
- Exhibit 160: Koninklijke DSM NV – Key news
- Exhibit 161: Koninklijke DSM NV – Key offerings
- Exhibit 162: Koninklijke DSM NV – Segment focus
- 12.12 Materion Corp.
- Exhibit 163: Materion Corp. – Overview
- Exhibit 164: Materion Corp. – Business segments
- Exhibit 165: Materion Corp. – Key offerings
- Exhibit 166: Materion Corp. – Segment focus
- 12.13 O Neal Industries
- Exhibit 167: O Neal Industries – Overview
- Exhibit 168: O Neal Industries – Product / Service
- Exhibit 169: O Neal Industries – Key offerings
- 12.14 Stryker Corp.
- Exhibit 170: Stryker Corp. – Overview
- Exhibit 171: Stryker Corp. – Business segments
- Exhibit 172: Stryker Corp. – Key news
- Exhibit 173: Stryker Corp. – Key offerings
- Exhibit 174: Stryker Corp. – Segment focus
- 12.15 Supra Alloys
- Exhibit 175: Supra Alloys – Overview
- Exhibit 176: Supra Alloys – Product / Service
- Exhibit 177: Supra Alloys – Key offerings
- 12.16 Ugitech SA
- Exhibit 178: Ugitech SA – Overview
- Exhibit 179: Ugitech SA – Product / Service
- Exhibit 180: Ugitech SA – Key offerings
- 12.17 Zimmer Biomet Holdings Inc.
- Exhibit 181: Zimmer Biomet Holdings Inc. – Overview
- Exhibit 182: Zimmer Biomet Holdings Inc. – Business segments
- Exhibit 183: Zimmer Biomet Holdings Inc. – Key news
- Exhibit 184: Zimmer Biomet Holdings Inc. – Key offerings
- Exhibit 185: Zimmer Biomet Holdings Inc. – Segment focus
13 Appendix
- 13.1 Scope of the report
- 13.2 Inclusions and exclusions checklist
- Exhibit 186: Inclusions checklist
- Exhibit 187: Exclusions checklist
- 13.3 Currency conversion rates for US$
- Exhibit 188: Currency conversion rates for US$
- 13.4 Research methodology
- Exhibit 189: Research methodology
- Exhibit 190: Validation techniques employed for market sizing
- Exhibit 191: Information sources
- 13.5 List of abbreviations
- Exhibit 192: List of abbreviations
About Us
Technavio is a leading global technology research and advisory company. Their research and analysis focus on emerging market trends and provide actionable insights to help businesses identify market opportunities and develop effective strategies to optimize their market positions. With over 500 specialized analysts, Technavio’s report library consists of more than 17,000 reports and counting, covering 800 technologies, spanning across 50 countries. Their client base consists of enterprises of all sizes, including more than 100 Fortune 500 companies. This growing client base relies on Technavio’s comprehensive coverage, extensive research, and actionable market insights to identify opportunities in existing and potential markets and assess their competitive positions within changing market scenarios.
Contact
Technavio Research
Jesse Maida
Media & Marketing Executive
US: +1 844 364 1100
UK: +44 203 893 3200
Email: media@technavio.com
Website: www.technavio.com/
SOURCE Technavio