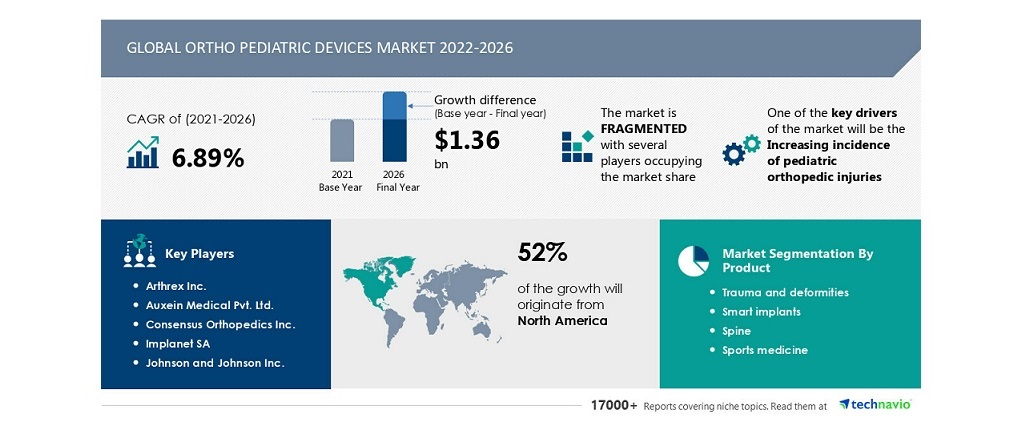
NEW YORK, July 18, 2023 /PRNewswire/ — The ortho-pediatric devices market size is expected to increase by USD 1.36 billion from 2021 to 2026, and the market’s growth momentum will accelerate at a CAGR of 6.89%, according to Technavio. The growing competition in the market is compelling vendors to adopt various growth strategies such as promotional activities and spending on advertisements to improve the visibility of their services. Technavio report analyzes the market’s competitive landscape and offers information on several market vendors including – Arthrex Inc., Auxein Medical Pvt. Ltd., Consensus Orthopedics Inc., Implanet SA, Johnson and Johnson Inc., Merete GmbH, Mighty Oak Medical, Nuvasive Inc., Orthofix Medical Inc., OrthoPediatrics Corp., Pega Medical Inc., Smith and Nephew plc, Stryker Corp., Treace Medical Concepts Inc., Trendlines Group Ltd., TST Medical Tools San. and Tic. Ltd. Sti. Kurtkoy Sanayi Mah., WishBone Medical Inc., Zimmer Biomet Holdings Inc., and Medtronic Plc. Download the sample report
Ortho Pediatric Devices Market Insights
- Vendors: 15+, Including Arthrex Inc., Auxein Medical Pvt. Ltd., Consensus Orthopedics Inc., Implanet SA, Johnson and Johnson Inc., Merete GmbH, Mighty Oak Medical, Nuvasive Inc., Orthofix Medical Inc., OrthoPediatrics Corp., Pega Medical Inc., Smith and Nephew plc, Stryker Corp., Treace Medical Concepts Inc., Trendlines Group Ltd., TST Medical Tools San. and Tic. Ltd. Sti. Kurtkoy Sanayi Mah., WishBone Medical Inc., Zimmer Biomet Holdings Inc., and Medtronic Plc, among others
- Coverage: Parent market analysis; key drivers, major trends, and challenges; customer and vendor landscape; vendor product insights and recent developments; key vendors; and market positioning of vendors
- Segments: Product (Trauma and deformities, Smart implants, Spine, and Sports medicine) and Geography (North America, Europe, Asia, and the Rest of the World (ROW))
To understand more about the ortho-pediatric devices market, request a sample report
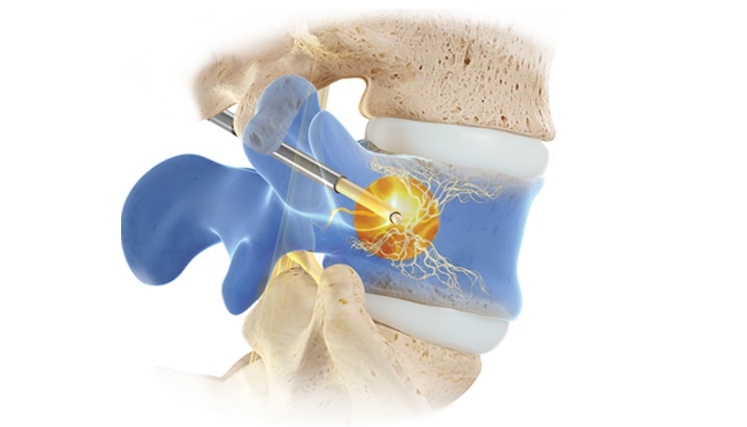
Key driver-The increasing incidence of pediatric orthopedic injuries is a key factor driving market growth. The demand for ortho pediatric devices is rapidly growing due to the increasing number of various issues such as orthopedic fractures, which are majorly caused during sports; spinal deformities and scoliosis; tendon injuries; spine, hip, and shoulder fractures. Furthermore, kids are considered more prone to injuries during sports. For example, every year, approximately 2.8 million children in the US visit an emergency department for injuries associated with falling, according to CDC data. Furthermore, treatment of scoliosis may be surgical or non-surgical and is performed using orthopedic devices. These devices include braces, spinal casts, rods, and other orthopedic devices. Hence, these factors are expected to drive market growth during the forecast period.
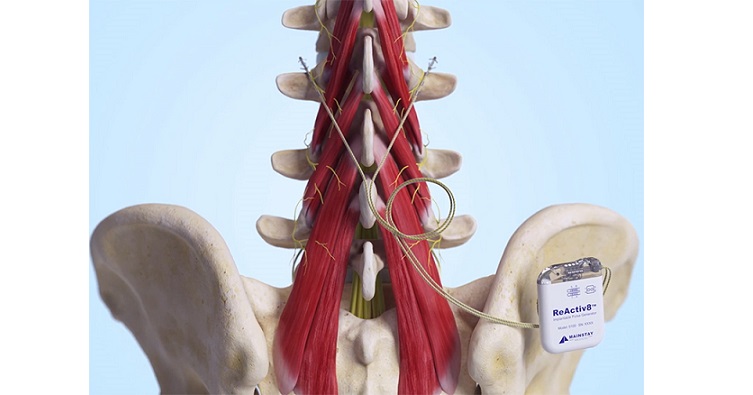
Major Trends-Increasing business strategies is a major trend in the market. The companies are focusing on increasing their sales by opting for various strategies such as mergers and acquisitions, distribution partnerships, and improved customer care. These strategies help them to expand their business and strengthen their market position. Vendors are getting motivated due to the increasing demand for ortho pediatric devices and helping them to reach new geographical locations. For instance, WishBone Medical, Inc signed a distribution agreement with children’s hospitals across the US for its PediGuard smart spinal drilling devices. As a result, it will provide access to pediatric orthopedic surgeons who perform spine surgery. Hence, these business strategies are expected to drive market growth during the forecast period.
Significant Challenges-The high costs associated with orthopedic devices and surgeries are a key factor restricting market growth. This is due to the applications and features which are added to the devices. These expensive devices are increasing the cost burden on end-users as well as patients. Furthermore, the cost of orthopedic devices, procedure charges, consultation fees, medicines, and consumable costs are the various costs that are included in orthopedic surgery. The average cost of inpatient orthopedic procedures ranges between USD 25,000 and USD 30,000. Similarly, the cost of outpatient surgeries ranges between USD 15,000 and USD 20,000. In addition, a patient may have to undergo repeated diagnostic tests, which further increases the cost burden on patients after Post orthopedic surgery. Hence, these high costs of devices are expected to hamper the market growth during the forecast period.
The ortho-pediatric devices market report provides critical information and factual data, with a qualitative and quantitative study of the market based on market drivers and limitations as well as prospects.
Why Buy?
- Add credibility to the strategy
- Analyzes competitor’s offerings
- Get a holistic view of the market
- Grow your profit margin with Technavio– Buy the Report
What are the key data covered in this Ortho Pediatric Devices Market report?
- CAGR of the market during the forecast period
- Detailed information on factors that will drive the growth of the ortho pediatric devices market between 2022 and 2026
- Precise estimation of the size of the ortho pediatric devices market and its contribution to the market with a focus on the parent market
- Accurate predictions about upcoming trends and changes in consumer behavior
- Growth of the ortho-pediatric devices market across North America, Europe, Asia, and the Rest of the World (ROW)
- A thorough analysis of the market’s competitive landscape and detailed information about vendors
- Comprehensive analysis of factors that will challenge the growth of ortho-pediatric devices market vendors
Gain instant access to 17,000+ market research reports.
Technavio’s SUBSCRIPTION platform
Related Reports
The needle-free injection systems market size is estimated to grow by USD 15,375.4 million at a CAGR of 15.06% between 2022 and 2027. Furthermore, this report extensively covers market segmentation by end-user (hospitals and clinics, home care settings, and research laboratories), product (fillable and pre-filled), and geography (North America, Europe, Asia, and the Rest of the World (ROW)). The increasing preference for minimally invasive biopsies is a key factor driving the growth of the market during the forecast period.
The ophthalmic handheld surgical instruments market size is estimated to grow by USD 360.3 million at a CAGR of 3.3% between 2022 and 2027. Furthermore, this report extensively covers market segmentation by end-user (hospitals, ophthalmic clinics, and others), products (ophthalmic knives, forceps, and scissors, and others), and geography (North America, Europe, Asia, and the Rest of the World (ROW)). The increasing detection of ophthalmic diseases is a key factor driving the growth of the market during the forecast period.
| Ortho Pediatric Devices Market Scope | |
| Report Coverage | Details |
| Base year | 2021 |
| Historic period | 2017-2021 |
| Forecast period | 2022-2026 |
| Growth momentum & CAGR | Accelerate at a CAGR of 6.89% |
| Market Growth 2022-2026 | USD 1.36 billion |
| Market structure | Fragmented |
| YoY growth 2022-2023 (%) | 6.4 |
| Regional analysis | North America, Europe, Asia, and Rest of World (ROW) |
| Performing market contribution | North America at 52% |
| Key countries | US, Canada, Germany, UK, and France |
| Competitive landscape | Leading Vendors, Market Positioning of Vendors, Competitive Strategies, and Industry Risks |
| Key companies profiled | Arthrex Inc., Auxein Medical Pvt. Ltd., Consensus Orthopedics Inc., Implanet SA, Johnson and Johnson Inc., Merete GmbH, Mighty Oak Medical, Nuvasive Inc., Orthofix Medical Inc., OrthoPediatrics Corp., Pega Medical Inc., Smith and Nephew plc, Stryker Corp., Treace Medical Concepts Inc., Trendlines Group Ltd., TST Medical Tools San. and Tic. Ltd. Sti. Kurtkoy Sanayi Mah., WishBone Medical Inc., Zimmer Biomet Holdings Inc., and Medtronic Plc |
| Market dynamics | Parent market analysis, Market growth inducers and obstacles, Fast-growing and slow-growing segment analysis, COVID-19 impact and recovery analysis and future consumer dynamics, and Market condition analysis for the forecast period. |
| Customization purview | If our report has not included the data that you are looking for, you can reach out to our analysts and get segments customized. |
Table of Contents
1 Executive Summary
- 1.1 Market Overview
- Exhibit 01: Executive Summary – Chart on Market Overview
- Exhibit 02: Executive Summary – Data Table on Market Overview
- Exhibit 03: Executive Summary – Chart on Global Market Characteristics
- Exhibit 04: Executive Summary – Chart on Market by Geography
- Exhibit 05: Executive Summary – Chart on Market Segmentation by Product
- Exhibit 06: Executive Summary – Chart on Incremental Growth
- Exhibit 07: Executive Summary – Data Table on Incremental Growth
- Exhibit 08: Executive Summary – Chart on Vendor Market Positioning
2 Market Landscape
- 2.1 Market ecosystem
- Exhibit 09: Parent market
- Exhibit 10: Market Characteristics
3 Market Sizing
- 3.1 Market definition
- Exhibit 11: Offerings of vendors included in the market definition
- 3.2 Market segment analysis
- Exhibit 12: Market segments
- 3.3 Market size 2021
- 3.4 Market outlook: Forecast for 2021-2026
- Exhibit 13: Chart on Global – Market size and forecast 2021-2026 ($ million)
- Exhibit 14: Data Table on Global – Market size and forecast 2021-2026 ($ million)
- Exhibit 15: Chart on Global Market: Year-over-year growth 2021-2026 (%)
- Exhibit 16: Data Table on Global Market: Year-over-year growth 2021-2026 (%)
4 Five Forces Analysis
- 4.1 Five forces summary
- Exhibit 17: Five forces analysis – Comparison between 2021 and 2026
- 4.2 Bargaining power of buyers
- Exhibit 18: Bargaining power of buyers – Impact of key factors in 2021 and 2026
- 4.3 Bargaining power of suppliers
- Exhibit 19: Bargaining power of suppliers – Impact of key factors in 2021 and 2026
- 4.4 Threat of new entrants
- Exhibit 20: Threat of new entrants – Impact of key factors in 2021 and 2026
- 4.5 Threat of substitutes
- Exhibit 21: Threat of substitutes – Impact of key factors in 2021 and 2026
- 4.6 Threat of rivalry
- Exhibit 22: Threat of rivalry – Impact of key factors in 2021 and 2026
- 4.7 Market condition
- Exhibit 23: Chart on Market condition – Five forces 2021 and 2026
5 Market Segmentation by Product
- 5.1 Market segments
- Exhibit 24: Chart on Product – Market share 2021-2026 (%)
- Exhibit 25: Data Table on Product – Market share 2021-2026 (%)
- 5.2 Comparison by Product
- Exhibit 26: Chart on Comparison by Product
- Exhibit 27: Data Table on Comparison by Product
- 5.3 Trauma and deformities – Market size and forecast 2021-2026
- Exhibit 28: Chart on Trauma and deformities – Market size and forecast 2021-2026 ($ million)
- Exhibit 29: Data Table on Trauma and deformities – Market size and forecast 2021-2026 ($ million)
- Exhibit 30: Chart on Trauma and deformities – Year-over-year growth 2021-2026 (%)
- Exhibit 31: Data Table on Trauma and deformities – Year-over-year growth 2021-2026 (%)
- 5.4 Smart implants – Market size and forecast 2021-2026
- Exhibit 32: Chart on Smart implants – Market size and forecast 2021-2026 ($ million)
- Exhibit 33: Data Table on Smart implants – Market size and forecast 2021-2026 ($ million)
- Exhibit 34: Chart on Smart implants – Year-over-year growth 2021-2026 (%)
- Exhibit 35: Data Table on Smart implants – Year-over-year growth 2021-2026 (%)
- 5.5 Spine – Market size and forecast 2021-2026
- Exhibit 36: Chart on Spine – Market size and forecast 2021-2026 ($ million)
- Exhibit 37: Data Table on Spine – Market size and forecast 2021-2026 ($ million)
- Exhibit 38: Chart on Spine – Year-over-year growth 2021-2026 (%)
- Exhibit 39: Data Table on Spine – Year-over-year growth 2021-2026 (%)
- 5.6 Sports medicine – Market size and forecast 2021-2026
- Exhibit 40: Chart on Sports medicine – Market size and forecast 2021-2026 ($ million)
- Exhibit 41: Data Table on Sports medicine – Market size and forecast 2021-2026 ($ million)
- Exhibit 42: Chart on Sports medicine – Year-over-year growth 2021-2026 (%)
- Exhibit 43: Data Table on Sports medicine – Year-over-year growth 2021-2026 (%)
- 5.7 Market opportunity by Product
- Exhibit 44: Market opportunity by Product ($ million)
6 Customer Landscape
- 6.1 Customer landscape overview
- Exhibit 45: Analysis of price sensitivity, lifecycle, customer purchase basket, adoption rates, and purchase criteria
7 Geographic Landscape
- 7.1 Geographic segmentation
- Exhibit 46: Chart on Market share by geography 2021-2026 (%)
- Exhibit 47: Data Table on Market share by geography 2021-2026 (%)
- 7.2 Geographic comparison
- Exhibit 48: Chart on Geographic comparison
- Exhibit 49: Data Table on Geographic comparison
- 7.3 North America – Market size and forecast 2021-2026
- Exhibit 50: Chart on North America – Market size and forecast 2021-2026 ($ million)
- Exhibit 51: Data Table on North America – Market size and forecast 2021-2026 ($ million)
- Exhibit 52: Chart on North America – Year-over-year growth 2021-2026 (%)
- Exhibit 53: Data Table on North America – Year-over-year growth 2021-2026 (%)
- 7.4 Europe – Market size and forecast 2021-2026
- Exhibit 54: Chart on Europe – Market size and forecast 2021-2026 ($ million)
- Exhibit 55: Data Table on Europe – Market size and forecast 2021-2026 ($ million)
- Exhibit 56: Chart on Europe – Year-over-year growth 2021-2026 (%)
- Exhibit 57: Data Table on Europe – Year-over-year growth 2021-2026 (%)
- 7.5 Asia – Market size and forecast 2021-2026
- Exhibit 58: Chart on Asia – Market size and forecast 2021-2026 ($ million)
- Exhibit 59: Data Table on Asia – Market size and forecast 2021-2026 ($ million)
- Exhibit 60: Chart on Asia – Year-over-year growth 2021-2026 (%)
- Exhibit 61: Data Table on Asia – Year-over-year growth 2021-2026 (%)
- 7.6 Rest of World (ROW) – Market size and forecast 2021-2026
- Exhibit 62: Chart on Rest of World (ROW) – Market size and forecast 2021-2026 ($ million)
- Exhibit 63: Data Table on Rest of World (ROW) – Market size and forecast 2021-2026 ($ million)
- Exhibit 64: Chart on Rest of World (ROW) – Year-over-year growth 2021-2026 (%)
- Exhibit 65: Data Table on Rest of World (ROW) – Year-over-year growth 2021-2026 (%)
- 7.7 US – Market size and forecast 2021-2026
- Exhibit 66: Chart on US – Market size and forecast 2021-2026 ($ million)
- Exhibit 67: Data Table on US – Market size and forecast 2021-2026 ($ million)
- Exhibit 68: Chart on US – Year-over-year growth 2021-2026 (%)
- Exhibit 69: Data Table on US – Year-over-year growth 2021-2026 (%)
- 7.8 Germany – Market size and forecast 2021-2026
- Exhibit 70: Chart on Germany – Market size and forecast 2021-2026 ($ million)
- Exhibit 71: Data Table on Germany – Market size and forecast 2021-2026 ($ million)
- Exhibit 72: Chart on Germany – Year-over-year growth 2021-2026 (%)
- Exhibit 73: Data Table on Germany – Year-over-year growth 2021-2026 (%)
- 7.9 UK – Market size and forecast 2021-2026
- Exhibit 74: Chart on UK – Market size and forecast 2021-2026 ($ million)
- Exhibit 75: Data Table on UK – Market size and forecast 2021-2026 ($ million)
- Exhibit 76: Chart on UK – Year-over-year growth 2021-2026 (%)
- Exhibit 77: Data Table on UK – Year-over-year growth 2021-2026 (%)
- 7.10 Canada – Market size and forecast 2021-2026
- Exhibit 78: Chart on Canada – Market size and forecast 2021-2026 ($ million)
- Exhibit 79: Data Table on Canada – Market size and forecast 2021-2026 ($ million)
- Exhibit 80: Chart on Canada – Year-over-year growth 2021-2026 (%)
- Exhibit 81: Data Table on Canada – Year-over-year growth 2021-2026 (%)
- 7.11 France – Market size and forecast 2021-2026
- Exhibit 82: Chart on France – Market size and forecast 2021-2026 ($ million)
- Exhibit 83: Data Table on France – Market size and forecast 2021-2026 ($ million)
- Exhibit 84: Chart on France – Year-over-year growth 2021-2026 (%)
- Exhibit 85: Data Table on France – Year-over-year growth 2021-2026 (%)
- 7.12 Market opportunity by geography
- Exhibit 86: Market opportunity by geography ($ million)
8 Drivers, Challenges, and Trends
- 8.1 Market drivers
- 8.2 Market challenges
- 8.3 Impact of drivers and challenges
- Exhibit 87: Impact of drivers and challenges in 2021 and 2026
- 8.4 Market trends
9 Vendor Landscape
- 9.1 Overview
- 9.2 Vendor landscape
- Exhibit 88: Overview on Criticality of inputs and Factors of differentiation
- 9.3 Landscape disruption
- Exhibit 89: Overview on factors of disruption
- 9.4 Industry risks
- Exhibit 90: Impact of key risks on business
10 Vendor Analysis
- 10.1 Vendors covered
- Exhibit 91: Vendors covered
- 10.2 Market positioning of vendors
- Exhibit 92: Matrix on vendor position and classification
- 10.3 Arthrex Inc.
- Exhibit 93: Arthrex Inc. – Overview
- Exhibit 94: Arthrex Inc. – Product / Service
- Exhibit 95: Arthrex Inc. – Key offerings
- 10.4 Johnson and Johnson Inc.
- Exhibit 96: Johnson and Johnson Inc. – Overview
- Exhibit 97: Johnson and Johnson Inc. – Business segments
- Exhibit 98: Johnson and Johnson Inc. – Key news
- Exhibit 99: Johnson and Johnson Inc. – Key offerings
- Exhibit 100: Johnson and Johnson Inc. – Segment focus
- 10.5 Nuvasive Inc.
- Exhibit 101: Nuvasive Inc. – Overview
- Exhibit 102: Nuvasive Inc. – Business segments
- Exhibit 103: Nuvasive Inc. – Key news
- Exhibit 104: Nuvasive Inc. – Key offerings
- Exhibit 105: Nuvasive Inc. – Segment focus
- 10.6 Orthofix Medical Inc.
- Exhibit 106: Orthofix Medical Inc. – Overview
- Exhibit 107: Orthofix Medical Inc. – Business segments
- Exhibit 108: Orthofix Medical Inc. – Key news
- Exhibit 109: Orthofix Medical Inc. – Key offerings
- Exhibit 110: Orthofix Medical Inc. – Segment focus
- 10.7 OrthoPediatrics Corp.
- Exhibit 111: OrthoPediatrics Corp. – Overview
- Exhibit 112: OrthoPediatrics Corp. – Business segments
- Exhibit 113: OrthoPediatrics Corp. – Key news
- Exhibit 114: OrthoPediatrics Corp. – Key offerings
- Exhibit 115: OrthoPediatrics Corp. – Segment focus
- 10.8 Pega Medical Inc.
- Exhibit 116: Pega Medical Inc. – Overview
- Exhibit 117: Pega Medical Inc. – Product / Service
- Exhibit 118: Pega Medical Inc. – Key offerings
- 10.9 Smith and Nephew plc
- Exhibit 119: Smith and Nephew plc – Overview
- Exhibit 120: Smith and Nephew plc – Business segments
- Exhibit 121: Smith and Nephew plc – Key news
- Exhibit 122: Smith and Nephew plc – Key offerings
- Exhibit 123: Smith and Nephew plc – Segment focus
- 10.10 Stryker Corp.
- Exhibit 124: Stryker Corp. – Overview
- Exhibit 125: Stryker Corp. – Business segments
- Exhibit 126: Stryker Corp. – Key news
- Exhibit 127: Stryker Corp. – Key offerings
- Exhibit 128: Stryker Corp. – Segment focus
- 10.11 WishBone Medical Inc.
- Exhibit 129: WishBone Medical Inc. – Overview
- Exhibit 130: WishBone Medical Inc. – Product / Service
- Exhibit 131: WishBone Medical Inc. – Key offerings
- 10.12 Zimmer Biomet Holdings Inc.
- Exhibit 132: Zimmer Biomet Holdings Inc. – Overview
- Exhibit 133: Zimmer Biomet Holdings Inc. – Business segments
- Exhibit 134: Zimmer Biomet Holdings Inc. – Key news
- Exhibit 135: Zimmer Biomet Holdings Inc. – Key offerings
- Exhibit 136: Zimmer Biomet Holdings Inc. – Segment focus
11 Appendix
- 11.1 Scope of the report
- 11.2 Inclusions and exclusions checklist
- Exhibit 137: Inclusions checklist
- Exhibit 138: Exclusions checklist
- 11.3 Currency conversion rates for US$
- Exhibit 139: Currency conversion rates for US$
- 11.4 Research methodology
- Exhibit 140: Research methodology
- Exhibit 141: Validation techniques employed for market sizing
- Exhibit 142: Information sources
- 11.5 List of abbreviations
- Exhibit 143: List of abbreviations
About Us
Technavio is a leading global technology research and advisory company. Their research and analysis focus on emerging market trends and provide actionable insights to help businesses identify market opportunities and develop effective strategies to optimize their market positions. With over 500 specialized analysts, Technavio’s report library consists of more than 17,000 reports and counting, covering 800 technologies, spanning 50 countries. Their client base consists of enterprises of all sizes, including more than 100 Fortune 500 companies. This growing client base relies on Technavio’s comprehensive coverage, extensive research, and actionable market insights to identify opportunities in existing and potential markets and assess their competitive positions within changing market scenarios.
Contact
Technavio Research
Jesse Maida
Media & Marketing Executive
US: +1 844 364 1100
UK: +44 203 893 3200
Email: media@technavio.com
Website: www.technavio.com
SOURCE Technavio