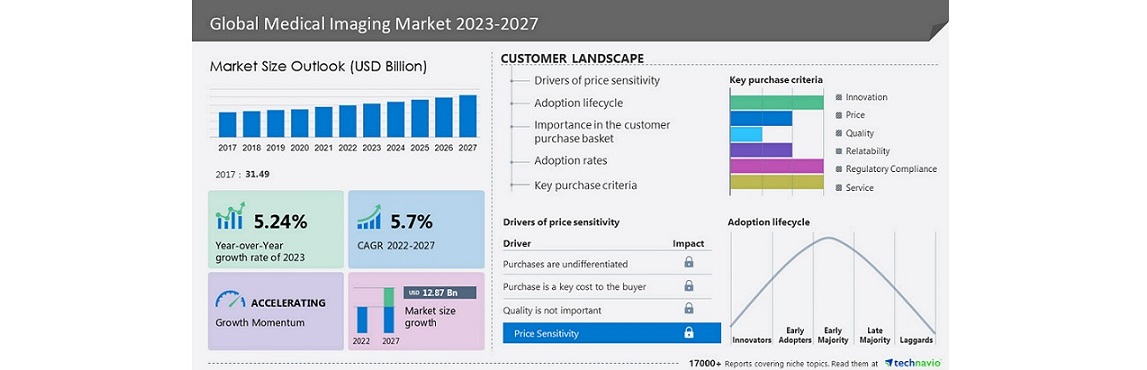
NEW YORK, Aug. 4, 2023 /PRNewswire/ — The Medical Imaging Market size is estimated to grow by USD 12.87 billion during 2022-2027. The market will be growing at a CAGR of 5.7% during the forecast period. North America will contribute to 36% of the market’s growth during the forecast period. The medical imaging market will grow significantly in North America due to various factors such as the rising prevalence of chronic diseases, new product launches, rising awareness programs regarding early disease diagnosis, and high healthcare spending. In addition, the increasing number of regulatory approvals and technological advances in imaging solutions will fuel the growth of the regional market. Comprehensive details on the market size of the historic period(2017 to 2021) and the forecast period (2023-2027) – View Sample report
Medical imaging market – Company Landscape
The medical imaging market is fragmented; the vendors are competing with competitors and are trying to get a greater market share. The market is growing, and the chances of new entrants cannot be overlooked. The major vendors have well-established economies of scale and market presence and generally rely on positioning technological advances, and the price of the products –The report provides a full list of key vendors, their strategies, and the latest developments. Buy Now
Medical imaging market – Market Dynamics
Major Drivers & Challenges-
The key factor driving growth in the medical imaging market increasing prevalence of chronic conditions. Medical imaging equipment is used for diagnosing severe and chronic conditions. The incidence of cancer and cardiovascular diseases is growing across the world. The high incidence of cancer is increasing the demand for cancer screening and diagnoses, which is expected to drive the growth of the global medical imaging market. Similarly, the increasing prevalence of other chronic conditions, such as cardiovascular diseases and neurological disorders, will augment the demand for medical imaging systems.
The high costs associated with medical imaging will be a major challenge for the medical imaging market during the forecast period. The high cost of medical imaging equipment and procedures can increase the cost burden on end-users and patients, respectively. For instance, the average cost of an MRI machine is in the range of USD 150,000-USD 300,000. Also, additional costs are needed for remodeling, installation, and maintenance. Additionally, medical imaging equipment requires annual service maintenance. The service maintenance cost includes the cost of preventative maintenance, parts, labor charges, and technicians’ allowance. This further increases the cost for end-users, such as hospitals, diagnostic centers, and clinics. The high costs associated with medical imaging procedures can reduce their adoption, especially in developing countries. This is expected to limit the growth of the market.
Key Trends–
Integration of AI with medical imaging is an emerging medical imaging market trend. AI-focused startups in medical imaging workflows and increased funding for AI solutions development have led to the rapid adoption of AI in this field. Companies such as NANOX IMAGING Ltd. received FDA clearance to market a single-source Nanox.ARC digital X-ray, further propels AI’s application in the medical imaging field. Hence, the integration of AI is an emerging trend influencing market growth during the forecast period.
Technavio has identified key trends, drivers, and challenges in the market, which will help clients improve their strategies to stay ahead of their competitors. – View Sample Report
Company Profiles
The medical imaging market report includes information on the product launches, sustainability, and prospects of leading vendors including Agfa Gevaert NV, Agilent Technologies Inc., Boston Scientific Corp., Canfield Scientific Inc., Canon Inc., Carestream Dental LLC, Danaher Corp., FUJIFILM Holdings Corp, General Electric Co., Hologic Inc., Konica Minolta Inc., Koninklijke Philips NV, Medical Imaging Systems, Medtronic Plc, Panasonic Holdings Corp., Samsung Electronics Co. Ltd., Shanghai United Imaging Healthcare Co. Ltd., Shenzhen Mindray BioMedical Electronics, Shimadzu Corp., Siemens AG, and STMicroelectronics NV.
Competitive Analysis
The report includes competitive analysis, a proprietary tool to analyze and evaluate the position of companies based on their industry position score and market performance score. The competitive scenario categorizes companies based on various performance indicators. Some of the factors considered include the financial performance of companies over the past few years, growth strategies, product innovations, new product launches, investments, and growth in market share, among others.
Medical imaging market – Market Segmentation
Technavio has segmented the market into Product (x-ray imaging, ultrasound imaging, MRI, CT scanner imaging, and spect/pet imaging), End-User (hospitals, diagnostic imaging centers, and others), and Geography (North America, Europe, Asia, and Rest of World (ROW)).
- The X-ray imaging segment is estimated to contribute significantly to the global market’s growth during the forecast period. The segment is driven by the increased adoption of portable and mobile X-ray systems. The development of new-generation mobile X-ray units that offer more advantages in terms of efficiency and cost savings compared with standalone X-ray systems will further drive the growth of the segment during the forecast period.
Gain instant access to 17,000+ market research reports.
Technavio’s SUBSCRIPTION platform
Related Reports:
The dental imaging market size is estimated to grow at a CAGR of 6.39% between 2022 and 2027. The dental imaging market size is forecast to increase by USD 1,281.75 million. This dental imaging market report extensively covers market segmentation by end-user (dental clinics and laboratories, hospitals and diagnostic centers, dental research institutes, and others), application (diagnostic, cosmetic, and forensic), and geography (North America, Europe, Asia, and Rest of World (ROW)). An increase in dental-related problems among the edentulous and geriatric population is notably driving the dental imaging market growth.
The cardiovascular ultrasound imaging systems market size is expected to increase to USD 592.22 million from 2021 to 2026, and the market’s growth momentum will accelerate at a CAGR of 5.44%. Furthermore, this report extensively covers cardiovascular ultrasound imaging systems market segmentation by product (2D, 3D, 4D, and 5D) and geography (North America, Europe, Asia, and Rest of World (ROW)). The increase in product launches is notably driving the cardiovascular ultrasound imaging systems market growth.
| Medical Imaging Market Scope | |
| Report Coverage | Details |
| Base year | 2022 |
| Historic period | 2017-2021 |
| Forecast period | 2023-2027 |
| Growth momentum & CAGR | Accelerate at a CAGR of 5.7% |
| Market growth 2023-2027 | USD 12.87 billion |
| Market structure | Fragmented |
| YoY growth 2022-2023 (%) | 5.24 |
| Regional analysis | North America, Europe, Asia, and Rest of World (ROW) |
| Performing market contribution | North America at 36% |
| Key countries | US, Germany, France, UK, and Japan |
| Competitive landscape | Leading Vendors, Market Positioning of Vendors, Competitive Strategies, and Industry Risks |
| Key companies profiled | Agfa Gevaert NV, Agilent Technologies Inc., Boston Scientific Corp., Canfield Scientific Inc., Canon Inc., Carestream Dental LLC, Danaher Corp., FUJIFILM Holdings Corp, General Electric Co., Hologic Inc., Konica Minolta Inc., Koninklijke Philips NV, Medical Imaging Systems, Medtronic Plc, Panasonic Holdings Corp., Samsung Electronics Co. Ltd., Shanghai United Imaging Healthcare Co. Ltd., Shenzhen Mindray BioMedical Electronics, Shimadzu Corp., Siemens AG, and STMicroelectronics NV |
| Market dynamics | Parent market analysis, Market growth inducers and obstacles, Fast-growing and slow-growing segment analysis, COVID-19 impact and recovery analysis and future consumer dynamics, Market condition analysis for forecast period. |
| Customization purview | If our report has not included the data that you are looking for, you can reach out to our analysts and get segments customized. |
Table of Contents
1 Executive Summary
- 1.1 Market overview
- Exhibit 01: Executive Summary – Chart on Market Overview
- Exhibit 02: Executive Summary – Data Table on Market Overview
- Exhibit 03: Executive Summary – Chart on Global Market Characteristics
- Exhibit 04: Executive Summary – Chart on Market by Geography
- Exhibit 05: Executive Summary – Chart on Market Segmentation by Product
- Exhibit 06: Executive Summary – Chart on Market Segmentation by End-user
- Exhibit 07: Executive Summary – Chart on Incremental Growth
- Exhibit 08: Executive Summary – Data Table on Incremental Growth
- Exhibit 09: Executive Summary – Chart on Vendor Market Positioning
2 Market Landscape
- 2.1 Market ecosystem
- Exhibit 10: Parent market
- Exhibit 11: Market Characteristics
3 Market Sizing
- 3.1 Market definition
- Exhibit 12: Offerings of vendors included in the market definition
- 3.2 Market segment analysis
- Exhibit 13: Market segments
- 3.3 Market size 2022
- 3.4 Market outlook: Forecast for 2022-2027
- Exhibit 14: Chart on Global – Market size and forecast 2022-2027 ($ billion)
- Exhibit 15: Data Table on Global – Market size and forecast 2022-2027 ($ billion)
- Exhibit 16: Chart on Global Market: Year-over-year growth 2022-2027 (%)
- Exhibit 17: Data Table on Global Market: Year-over-year growth 2022-2027 (%)
4 Historic Market Size
- 4.1 Global medical imaging market 2017 – 2021
- Exhibit 18: Historic Market Size – Data Table on Global medical imaging market 2017 – 2021 ($ billion)
- 4.2 Product Segment Analysis 2017 – 2021
- Exhibit 19: Historic Market Size – Product Segment 2017 – 2021 ($ billion)
- 4.3 End-user Segment Analysis 2017 – 2021
- Exhibit 20: Historic Market Size – End-user Segment 2017 – 2021 ($ billion)
- 4.4 Geography Segment Analysis 2017 – 2021
- Exhibit 21: Historic Market Size – Geography Segment 2017 – 2021 ($ billion)
- 4.5 Country Segment Analysis 2017 – 2021
- Exhibit 22: Historic Market Size – Country Segment 2017 – 2021 ($ billion)
5 Five Forces Analysis
- 5.1 Five forces summary
- Exhibit 23: Five forces analysis – Comparison between 2022 and 2027
- 5.2 Bargaining power of buyers
- Exhibit 24: Chart on Bargaining power of buyers – Impact of key factors 2022 and 2027
- 5.3 Bargaining power of suppliers
- Exhibit 25: Bargaining power of suppliers – Impact of key factors in 2022 and 2027
- 5.4 Threat of new entrants
- Exhibit 26: Threat of new entrants – Impact of key factors in 2022 and 2027
- 5.5 Threat of substitutes
- Exhibit 27: Threat of substitutes – Impact of key factors in 2022 and 2027
- 5.6 Threat of rivalry
- Exhibit 28: Threat of rivalry – Impact of key factors in 2022 and 2027
- 5.7 Market condition
- Exhibit 29: Chart on Market condition – Five forces 2022 and 2027
6 Market Segmentation by Product
- 6.1 Market segments
- Exhibit 30: Chart on Product – Market share 2022-2027 (%)
- Exhibit 31: Data Table on Product – Market share 2022-2027 (%)
- 6.2 Comparison by Product
- Exhibit 32: Chart on Comparison by Product
- Exhibit 33: Data Table on Comparison by Product
- 6.3 X-ray imaging – Market size and forecast 2022-2027
- Exhibit 34: Chart on X-ray imaging – Market size and forecast 2022-2027 ($ billion)
- Exhibit 35: Data Table on X-ray imaging – Market size and forecast 2022-2027 ($ billion)
- Exhibit 36: Chart on X-ray imaging – Year-over-year growth 2022-2027 (%)
- Exhibit 37: Data Table on X-ray imaging – Year-over-year growth 2022-2027 (%)
- 6.4 Ultrasound imaging – Market size and forecast 2022-2027
- Exhibit 38: Chart on Ultrasound imaging – Market size and forecast 2022-2027 ($ billion)
- Exhibit 39: Data Table on Ultrasound imaging – Market size and forecast 2022-2027 ($ billion)
- Exhibit 40: Chart on Ultrasound imaging – Year-over-year growth 2022-2027 (%)
- Exhibit 41: Data Table on Ultrasound imaging – Year-over-year growth 2022-2027 (%)
- 6.5 MRI – Market size and forecast 2022-2027
- Exhibit 42: Chart on MRI – Market size and forecast 2022-2027 ($ billion)
- Exhibit 43: Data Table on MRI – Market size and forecast 2022-2027 ($ billion)
- Exhibit 44: Chart on MRI – Year-over-year growth 2022-2027 (%)
- Exhibit 45: Data Table on MRI – Year-over-year growth 2022-2027 (%)
- 6.6 CT scanner imaging – Market size and forecast 2022-2027
- Exhibit 46: Chart on CT scanner imaging – Market size and forecast 2022-2027 ($ billion)
- Exhibit 47: Data Table on CT scanner imaging – Market size and forecast 2022-2027 ($ billion)
- Exhibit 48: Chart on CT scanner imaging – Year-over-year growth 2022-2027 (%)
- Exhibit 49: Data Table on CT scanner imaging – Year-over-year growth 2022-2027 (%)
- 6.7 SPECT and PET imaging – Market size and forecast 2022-2027
- Exhibit 50: Chart on SPECT and PET imaging – Market size and forecast 2022-2027 ($ billion)
- Exhibit 51: Data Table on SPECT and PET imaging – Market size and forecast 2022-2027 ($ billion)
- Exhibit 52: Chart on SPECT and PET imaging – Year-over-year growth 2022-2027 (%)
- Exhibit 53: Data Table on SPECT and PET imaging – Year-over-year growth 2022-2027 (%)
- 6.8 Market opportunity by Product
- Exhibit 54: Market opportunity by Product ($ billion)
7 Market Segmentation by End-user
- 7.1 Market segments
- Exhibit 55: Chart on End-user – Market share 2022-2027 (%)
- Exhibit 56: Data Table on End-user – Market share 2022-2027 (%)
- 7.2 Comparison by End-user
- Exhibit 57: Chart on Comparison by End-user
- Exhibit 58: Data Table on Comparison by End-user
- 7.3 Hospitals – Market size and forecast 2022-2027
- Exhibit 59: Chart on Hospitals – Market size and forecast 2022-2027 ($ billion)
- Exhibit 60: Data Table on Hospitals – Market size and forecast 2022-2027 ($ billion)
- Exhibit 61: Chart on Hospitals – Year-over-year growth 2022-2027 (%)
- Exhibit 62: Data Table on Hospitals – Year-over-year growth 2022-2027 (%)
- 7.4 Diagnostic imaging centers – Market size and forecast 2022-2027
- Exhibit 63: Chart on Diagnostic imaging centers – Market size and forecast 2022-2027 ($ billion)
- Exhibit 64: Data Table on Diagnostic imaging centers – Market size and forecast 2022-2027 ($ billion)
- Exhibit 65: Chart on Diagnostic imaging centers – Year-over-year growth 2022-2027 (%)
- Exhibit 66: Data Table on Diagnostic imaging centers – Year-over-year growth 2022-2027 (%)
- 7.5 Others – Market size and forecast 2022-2027
- Exhibit 67: Chart on Others – Market size and forecast 2022-2027 ($ billion)
- Exhibit 68: Data Table on Others – Market size and forecast 2022-2027 ($ billion)
- Exhibit 69: Chart on Others – Year-over-year growth 2022-2027 (%)
- Exhibit 70: Data Table on Others – Year-over-year growth 2022-2027 (%)
- 7.6 Market opportunity by End-user
- Exhibit 71: Market opportunity by End-user ($ billion)
8 Customer Landscape
- 8.1 Customer landscape overview
- Exhibit 72: Analysis of price sensitivity, lifecycle, customer purchase basket, adoption rates, and purchase criteria
9 Geographic Landscape
- 9.1 Geographic segmentation
- Exhibit 73: Chart on Market share by geography 2022-2027 (%)
- Exhibit 74: Data Table on Market share by geography 2022-2027 (%)
- 9.2 Geographic comparison
- Exhibit 75: Chart on Geographic comparison
- Exhibit 76: Data Table on Geographic comparison
- 9.3 North America – Market size and forecast 2022-2027
- Exhibit 77: Chart on North America – Market size and forecast 2022-2027 ($ billion)
- Exhibit 78: Data Table on North America – Market size and forecast 2022-2027 ($ billion)
- Exhibit 79: Chart on North America – Year-over-year growth 2022-2027 (%)
- Exhibit 80: Data Table on North America – Year-over-year growth 2022-2027 (%)
- 9.4 Europe – Market size and forecast 2022-2027
- Exhibit 81: Chart on Europe – Market size and forecast 2022-2027 ($ billion)
- Exhibit 82: Data Table on Europe – Market size and forecast 2022-2027 ($ billion)
- Exhibit 83: Chart on Europe – Year-over-year growth 2022-2027 (%)
- Exhibit 84: Data Table on Europe – Year-over-year growth 2022-2027 (%)
- 9.5 Asia – Market size and forecast 2022-2027
- Exhibit 85: Chart on Asia – Market size and forecast 2022-2027 ($ billion)
- Exhibit 86: Data Table on Asia – Market size and forecast 2022-2027 ($ billion)
- Exhibit 87: Chart on Asia – Year-over-year growth 2022-2027 (%)
- Exhibit 88: Data Table on Asia – Year-over-year growth 2022-2027 (%)
- 9.6 Rest of World (ROW) – Market size and forecast 2022-2027
- Exhibit 89: Chart on Rest of World (ROW) – Market size and forecast 2022-2027 ($ billion)
- Exhibit 90: Data Table on Rest of World (ROW) – Market size and forecast 2022-2027 ($ billion)
- Exhibit 91: Chart on Rest of World (ROW) – Year-over-year growth 2022-2027 (%)
- Exhibit 92: Data Table on Rest of World (ROW) – Year-over-year growth 2022-2027 (%)
- 9.7 US – Market size and forecast 2022-2027
- Exhibit 93: Chart on US – Market size and forecast 2022-2027 ($ billion)
- Exhibit 94: Data Table on US – Market size and forecast 2022-2027 ($ billion)
- Exhibit 95: Chart on US – Year-over-year growth 2022-2027 (%)
- Exhibit 96: Data Table on US – Year-over-year growth 2022-2027 (%)
- 9.8 Germany – Market size and forecast 2022-2027
- Exhibit 97: Chart on Germany – Market size and forecast 2022-2027 ($ billion)
- Exhibit 98: Data Table on Germany – Market size and forecast 2022-2027 ($ billion)
- Exhibit 99: Chart on Germany – Year-over-year growth 2022-2027 (%)
- Exhibit 100: Data Table on Germany – Year-over-year growth 2022-2027 (%)
- 9.9 Japan – Market size and forecast 2022-2027
- Exhibit 101: Chart on Japan – Market size and forecast 2022-2027 ($ billion)
- Exhibit 102: Data Table on Japan – Market size and forecast 2022-2027 ($ billion)
- Exhibit 103: Chart on Japan – Year-over-year growth 2022-2027 (%)
- Exhibit 104: Data Table on Japan – Year-over-year growth 2022-2027 (%)
- 9.10 France – Market size and forecast 2022-2027
- Exhibit 105: Chart on France – Market size and forecast 2022-2027 ($ billion)
- Exhibit 106: Data Table on France – Market size and forecast 2022-2027 ($ billion)
- Exhibit 107: Chart on France – Year-over-year growth 2022-2027 (%)
- Exhibit 108: Data Table on France – Year-over-year growth 2022-2027 (%)
- 9.11 UK – Market size and forecast 2022-2027
- Exhibit 109: Chart on UK – Market size and forecast 2022-2027 ($ billion)
- Exhibit 110: Data Table on UK – Market size and forecast 2022-2027 ($ billion)
- Exhibit 111: Chart on UK – Year-over-year growth 2022-2027 (%)
- Exhibit 112: Data Table on UK – Year-over-year growth 2022-2027 (%)
- 9.12 Market opportunity by geography
- Exhibit 113: Market opportunity by geography ($ billion)
10 Drivers, Challenges, and Trends
- 10.1 Market drivers
- 10.2 Market challenges
- 10.3 Impact of drivers and challenges
- Exhibit 114: Impact of drivers and challenges in 2022 and 2027
- 10.4 Market trends
11 Vendor Landscape
- 11.1 Overview
- 11.2 Vendor landscape
- Exhibit 115: Overview on Criticality of inputs and Factors of differentiation
- 11.3 Landscape disruption
- Exhibit 116: Overview on factors of disruption
- 11.4 Industry risks
- Exhibit 117: Impact of key risks on business
12 Vendor Analysis
- 12.1 Vendors covered
- Exhibit 118: Vendors covered
- 12.2 Market positioning of vendors
- Exhibit 119: Matrix on vendor position and classification
- 12.3 Agfa Gevaert NV
- Exhibit 120: Agfa Gevaert NV – Overview
- Exhibit 121: Agfa Gevaert NV – Business segments
- Exhibit 122: Agfa Gevaert NV – Key offerings
- Exhibit 123: Agfa Gevaert NV – Segment focus
- 12.4 Agilent Technologies Inc.
- Exhibit 124: Agilent Technologies Inc. – Overview
- Exhibit 125: Agilent Technologies Inc. – Business segments
- Exhibit 126: Agilent Technologies Inc. – Key news
- Exhibit 127: Agilent Technologies Inc. – Key offerings
- Exhibit 128: Agilent Technologies Inc. – Segment focus
- 12.5 Boston Scientific Corp.
- Exhibit 129: Boston Scientific Corp. – Overview
- Exhibit 130: Boston Scientific Corp. – Business segments
- Exhibit 131: Boston Scientific Corp. – Key news
- Exhibit 132: Boston Scientific Corp. – Key offerings
- Exhibit 133: Boston Scientific Corp. – Segment focus
- 12.6 Canon Inc.
- Exhibit 134: Canon Inc. – Overview
- Exhibit 135: Canon Inc. – Business segments
- Exhibit 136: Canon Inc. – Key offerings
- Exhibit 137: Canon Inc. – Segment focus
- 12.7 Danaher Corp.
- Exhibit 138: Danaher Corp. – Overview
- Exhibit 139: Danaher Corp. – Business segments
- Exhibit 140: Danaher Corp. – Key news
- Exhibit 141: Danaher Corp. – Key offerings
- Exhibit 142: Danaher Corp. – Segment focus
- 12.8 FUJIFILM Holdings Corp
- Exhibit 143: FUJIFILM Holdings Corp – Overview
- Exhibit 144: FUJIFILM Holdings Corp – Business segments
- Exhibit 145: FUJIFILM Holdings Corp – Key offerings
- Exhibit 146: FUJIFILM Holdings Corp – Segment focus
- 12.9 General Electric Co.
- Exhibit 147: General Electric Co. – Overview
- Exhibit 148: General Electric Co. – Business segments
- Exhibit 149: General Electric Co. – Key news
- Exhibit 150: General Electric Co. – Key offerings
- Exhibit 151: General Electric Co. – Segment focus
- 12.10 Hologic Inc.
- Exhibit 152: Hologic Inc. – Overview
- Exhibit 153: Hologic Inc. – Business segments
- Exhibit 154: Hologic Inc. – Key news
- Exhibit 155: Hologic Inc. – Key offerings
- Exhibit 156: Hologic Inc. – Segment focus
- 12.11 Konica Minolta Inc.
- Exhibit 157: Konica Minolta Inc. – Overview
- Exhibit 158: Konica Minolta Inc. – Business segments
- Exhibit 159: Konica Minolta Inc. – Key news
- Exhibit 160: Konica Minolta Inc. – Key offerings
- Exhibit 161: Konica Minolta Inc. – Segment focus
- 12.12 Koninklijke Philips NV
- Exhibit 162: Koninklijke Philips NV – Overview
- Exhibit 163: Koninklijke Philips NV – Business segments
- Exhibit 164: Koninklijke Philips NV – Key news
- Exhibit 165: Koninklijke Philips NV – Key offerings
- Exhibit 166: Koninklijke Philips NV – Segment focus
- 12.13 Medtronic Plc
- Exhibit 167: Medtronic Plc – Overview
- Exhibit 168: Medtronic Plc – Business segments
- Exhibit 169: Medtronic Plc – Key news
- Exhibit 170: Medtronic Plc – Key offerings
- Exhibit 171: Medtronic Plc – Segment focus
- 12.14 Panasonic Holdings Corp.
- Exhibit 172: Panasonic Holdings Corp. – Overview
- Exhibit 173: Panasonic Holdings Corp. – Business segments
- Exhibit 174: Panasonic Holdings Corp. – Key news
- Exhibit 175: Panasonic Holdings Corp. – Key offerings
- Exhibit 176: Panasonic Holdings Corp. – Segment focus
- 12.15 Samsung Electronics Co. Ltd.
- Exhibit 177: Samsung Electronics Co. Ltd. – Overview
- Exhibit 178: Samsung Electronics Co. Ltd. – Business segments
- Exhibit 179: Samsung Electronics Co. Ltd. – Key news
- Exhibit 180: Samsung Electronics Co. Ltd. – Key offerings
- Exhibit 181: Samsung Electronics Co. Ltd. – Segment focus
- 12.16 Shanghai United Imaging Healthcare Co. Ltd.
- Exhibit 182: Shanghai United Imaging Healthcare Co. Ltd. – Overview
- Exhibit 183: Shanghai United Imaging Healthcare Co. Ltd. – Product / Service
- Exhibit 184: Shanghai United Imaging Healthcare Co. Ltd. – Key offerings
- 12.17 STMicroelectronics NV
- Exhibit 185: STMicroelectronics NV – Overview
- Exhibit 186: STMicroelectronics NV – Business segments
- Exhibit 187: STMicroelectronics NV – Key news
- Exhibit 188: STMicroelectronics NV – Key offerings
- Exhibit 189: STMicroelectronics NV – Segment focus
13 Appendix
- 13.1 Scope of the report
- 13.2 Inclusions and exclusions checklist
- Exhibit 190: Inclusions checklist
- Exhibit 191: Exclusions checklist
- 13.3 Currency conversion rates for US$
- Exhibit 192: Currency conversion rates for US$
- 13.4 Research methodology
- Exhibit 193: Research methodology
- Exhibit 194: Validation techniques employed for market sizing
- Exhibit 195: Information sources
- 13.5 List of abbreviations
- Exhibit 196: List of abbreviations
About Us
Technavio is a leading global technology research and advisory company. Their research and analysis focus on emerging market trends and provide actionable insights to help businesses identify market opportunities and develop effective strategies to optimize their market positions. With over 500 specialized analysts, Technavio’s report library consists of more than 17,000 reports and counting, covering 800 technologies, spanning 50 countries. Their client base consists of enterprises of all sizes, including more than 100 Fortune 500 companies. This growing client base relies on Technavio’s comprehensive coverage, extensive research, and actionable market insights to identify opportunities in existing and potential markets and assess their competitive positions within changing market scenarios.
Contact
Technavio Research
Jesse Maida
Media & Marketing Executive
US: +1 844 364 1100
UK: +44 203 893 3200
Email: media@technavio.com
Website: www.technavio.com
SOURCE Technavio